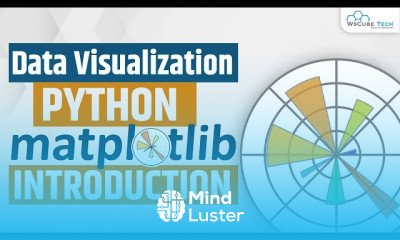
Step Plots in matplotlib for beginner Course

 (103 reviews)
-
 16 Lessons
-
 5 Students
- Certificate of completion


Step Plots in matplotlib course in hindi, in this course dedicated to exploring the intricacies of creating step plots using Matplotlib, a popular Python library for data visualization. Step plots are instrumental in illustrating data that changes discretely over defined intervals, commonly seen in time series data or event-driven datasets. Throughout the course, learners delve into the fundamentals of step plots, mastering techniques to accurately represent data with clear horizontal and vertical lines. Topics covered include understanding the syntax and usage of Matplotlib's step function, customization options for enhancing visualizations, and practical applications in various domains such as finance, engineering, and scientific research. By the end of the course, participants will possess a comprehensive understanding of step plots in Matplotlib, equipped with the skills to effectively visualize and analyze discrete data patterns. Whether you're a beginner seeking to expand your data visualization skills or a seasoned data scientist aiming to refine your plotting techniques, Step Plots in Matplotlib offers valuable insights and practical knowledge to elevate your proficiency in creating impactful visualizations. Join us on this insightful journey as we unravel the power and versatility of step plots in Matplotlib.
 To Register in Course you have to watch at least 30 Second of any lesson
What You'll Learn
-
 Create step plots in matplotlib to visualize discrete data changes effectively using Python libraries data visualization skills
-
Customize matplotlib step plots with colors, styles, and labels for clear, professional data representations in Python
-
Apply step plots to real-world datasets in finance, engineering, and scientific research for insightful data analysis
-
Interpret step plot features to analyze time series, event-driven data, and categorical datasets accurately
-
Utilize matplotlib's step function syntax to generate precise and customizable step charts in Python
-
Enhance data storytelling by integrating step plots into comprehensive visualizations for presentations and reports
-
Identify best practices for designing clear, informative step plots tailored to specific data visualization needs
-
Troubleshoot common issues in matplotlib step plots to ensure accurate and visually appealing data visualizations
Course Content
16 Lessons • 4 h 25 m total

Data Visualization Python What is Matplotlib in Python with example Matplotlib Tutorial
How to Install Jupyter Notebook in Windows 10 Fully Explained
Matplotlib Bar Plot How to Plot a Bar Chart in Python using Matplotlib Complete Tutorial
Matplotlib Scatter Plot How to Create a Scatterplot in Python Matplotlib Complete Tutorial
Learn How to Plot Bar Graph in Matplotlib Matplotlib Python Tutorial in Hindi
HISTOGRAM CHART IN MATPLOTLIB Learn HISTOGRAM PLOT IN MATPLOTLIB Python Matplotlib Tutorial
Matplotlib Pie Chart Plot How to Create a Pie Chart in Python Matplotlib Complete Tutorial
Stem Plots with Matplotlib What are Stem Plots Matplotlib Python Tutorial
Box Vs Whisker Plot How do you Plot a Box and Whisker Plot Python Using Matplotlib Tutorial
Area Vs Stack Plot How do you Plot Stack and Area Plot Python Using Matplotlib Tutorial
Matplotlib Step Plot How to Create Step Plot in Python Matplotlib Complete Tutorial
Fill Between Plot in Matplotlib Python Matplotlib Python Tutorial
matplotlib subplot How do you plot a subplot in Python using Matplotlib Matplotlib Tutorial
Matplotlib Savefig How do I use Savefig in Matplotlib Python Matplotlib Tutorial
Axis Matplotlib Plots How to Change Axis in matplotlib Python Matplotlib Tutorial
Text in Matplotlib Plots How to Add Text on Plots Matplotlib Tutorial
How to Get The Certificate
-
You must have an
Account
on the platform.
-
Complete all lessons.
-
Watch at least 50% of Lesson Duration.
-
Get your Certificate free 🎉 !
4.2
(103 reviews)
Overall rating

Reviews
Be the First One Review This Course
Related Courses
View All
















Step Plots in matplotlib for beginner Course Description
Step Plots in matplotlib course in hindi, in this course dedicated to exploring the intricacies of creating step plots using Matplotlib, a popular Python library for data visualization. Step plots are instrumental in illustrating data that changes discretely over defined intervals, commonly seen in time series data or event-driven datasets. Throughout the course, learners delve into the fundamentals of step plots, mastering techniques to accurately represent data with clear horizontal and vertical lines. Topics covered include understanding the syntax and usage of Matplotlib's step function, customization options for enhancing visualizations, and practical applications in various domains such as finance, engineering, and scientific research. By the end of the course, participants will possess a comprehensive understanding of step plots in Matplotlib, equipped with the skills to effectively visualize and analyze discrete data patterns. Whether you're a beginner seeking to expand your data visualization skills or a seasoned data scientist aiming to refine your plotting techniques, Step Plots in Matplotlib offers valuable insights and practical knowledge to elevate your proficiency in creating impactful visualizations. Join us on this insightful journey as we unravel the power and versatility of step plots in Matplotlib.
Focus on Learning, Not Ads
Experience the full power of Mindluster with Premium.
No distractions, just pure education.
Cancel your subscription anytime
