

Vikas Kumar
Good
 (81 reviews)
 9 Lessons
 629 Students
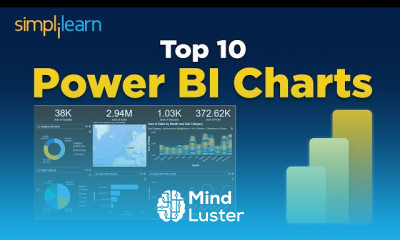
Data Visualization In-Depth | Data Visualization Tutorial | Simplilearn course provides comprehensive training on the principles and techniques of data visualization. Explore various visualization tools, best practices, and real-world examples to effectively present and communicate data insights. Enhance your skills in creating visually appealing and informative charts, graphs, and dashboards. With this course, you'll gain expertise in data visualization, enabling you to make data-driven decisions and effectively communicate complex information. Simplilearn
 To Register in Course you have to watch at least 30 Second of any lesson
 Create compelling data visualizations using R to communicate insights effectively with advanced charting techniques and best practices
Apply principles of data visualization to design clear, accurate, and engaging dashboards for diverse audiences and industries
Utilize R libraries like ggplot2, plotly, and shiny to develop interactive and static visualizations for data storytelling and analysis
Interpret complex data sets visually to identify trends, patterns, and outliers that inform strategic decision-making
Implement data visualization workflows in R to streamline the process of transforming raw data into insightful visual reports
Evaluate visualization tools and techniques to select the most appropriate methods for different data types and presentation goals
9 Lessons • 13 h 49 m total
 You must have an
Account
on the platform.
Complete all lessons.
Watch at least 50% of Lesson Duration.
Get your Certificate free 🎉 !
4.4
(81 reviews)
Overall rating

Be the First One Review This Course
Good

Good

super

Very Nici

noice
Good
GOOD

Very powerful

Excellent

useful

nice
Good

Data Visualization In-Depth | Data Visualization Tutorial | Simplilearn course provides comprehensive training on the principles and techniques of data visualization. Explore various visualization tools, best practices, and real-world examples to effectively present and communicate data insights. Enhance your skills in creating visually appealing and informative charts, graphs, and dashboards. With this course, you'll gain expertise in data visualization, enabling you to make data-driven decisions and effectively communicate complex information. Simplilearn
Experience the full power of Mindluster with Premium.
No distractions, just pure education.
Cancel your subscription anytime