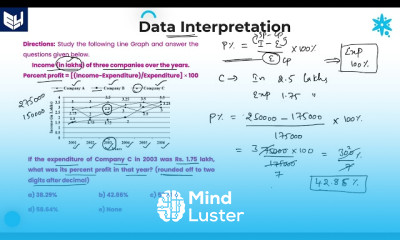
Data interpretation with line graphs Course

 (172 reviews)
-
 25 Lessons
-
 9 Students
- Certificate of completion


Data interpretation with line graphs course, in this course we will learn about Data Interpretation with Line Graphs. This course offers a comprehensive introduction to the techniques and skills required to accurately interpret data presented in line graphs. Starting with the basics, we will explore how to understand the axes of a line graph, including identifying the independent and dependent variables. You will learn how to read and analyze data points, as well as understand the significance of the lines connecting these points to reveal trends, patterns, and relationships over time or across different categories. Through practical examples and exercises, you will gain hands-on experience in identifying key insights from line graphs, such as detecting increases, decreases, and stable periods. The course will also cover advanced topics, such as comparing multiple data sets within a single graph and understanding the implications of various data patterns. By the end of this course, you will have the skills necessary to effectively use line graphs for data analysis, enabling you to make informed decisions based on visual data representations. This course is ideal for students, professionals, and anyone interested in enhancing their data analysis capabilities through the use of line graphs.
 To Register in Course you have to watch at least 30 Second of any lesson
What You'll Learn
-
 Interpret and analyze data points on line graphs to identify trends and patterns accurately
-
Understand axes, variables, and data relationships in line graphs for precise data interpretation
-
Compare multiple data sets within a single line graph to identify differences and similarities effectively
-
Detect increases, decreases, and stable periods in data using line graph analysis techniques
-
Apply practical skills to interpret line graphs for real-world data analysis and decision-making
-
Recognize the significance of connecting lines to understand data trends over time or categories
-
Utilize line graphs to extract key insights for business, academic, or professional data presentations
-
Enhance data literacy by mastering visualization and interpretation of line graph data patterns
-
Develop critical thinking skills to evaluate data reliability and identify anomalies in line graphs
-
Use line graph analysis to support informed decision-making in various professional contexts
Course Content
25 Lessons • 8 h 23 m total

Line Graph Companies Income Data Interpretation Reasoning Part 01 Bharath Kumar
Line Graph Production Rise DI Reasoning Part 02 Bharath Kumar
Line Graph Company Profit DI Reasoning Part 03 Bharath Kumar
Line Graph Profit earned DI Reasoning Part 04 Bharath Kumar
Line Graph Metal Plastic Consumption DI Reasoning Part 05 Bharath Kumar
Line Graph of Profit DI Reasoning Part 06 Bharath Kumar
Line Graph Companies Profit DI Reasoning Part 07 Bharath Kumar
Line Graph No of Students Passed DI Reasoning Part 08 Bharath Kumar
Line Graph Investment DI Reasoning Part 09 Bharath Kumar
Line Graph of marks DI Reasoning Part 10 Bharath Kumar
Line Graph Manufactured Sold DI Reasoning Part 11 Bharath Kumar
Line Graph Iron Import DI Reasoning Part 12 Bharath Kumar
Line Graph Company Production DI Reasoning Part 13 Bharath Kumar
Line Graph Employees Selection DI Reasoning Part 14 Bharath Kumar
Line Graph Manufactured Sold DI Reasoning Part 15 Bharath Kumar
Line Graph Percent Profit DI Reasoning Part 16 Bharath Kumar
Line Graph Cost of Fruits DI Reasoning Part 17 Bharath Kumar
Line Graph Companies Imports DI Reasoning Part 18 Bharath Kumar
Line Graph Population Rise DI Reasoning Part 19 Bharath Kumar
Line Graph Cooler sales by SIX companies DI Reasoning Part 20 Bharath Kumar
Line Graph Buildings in cities DI Reasoning Part 21 Bharath Kumar
Line Graph Computers Manufactured Sales DI Reasoning Part 22 Bharath Kumar
Line Graph Quantity Sold DI Reasoning Part 23 Bharath Kumar
Line Graph No of Employees DI Reasoning Part 24 Bharath Kumar
Line Graph Companies Turn Over DI Reasoning Part 25 Bharath Kumar
How to Get The Certificate
-
You must have an
Account
on the platform.
-
Complete all lessons.
-
Watch at least 50% of Lesson Duration.
-
Get your Certificate free 🎉 !
4.8
(172 reviews)
Overall rating

Reviews
Be the First One Review This Course
Related Courses
View All
















Data interpretation with line graphs Course Description
Data interpretation with line graphs course, in this course we will learn about Data Interpretation with Line Graphs. This course offers a comprehensive introduction to the techniques and skills required to accurately interpret data presented in line graphs. Starting with the basics, we will explore how to understand the axes of a line graph, including identifying the independent and dependent variables. You will learn how to read and analyze data points, as well as understand the significance of the lines connecting these points to reveal trends, patterns, and relationships over time or across different categories. Through practical examples and exercises, you will gain hands-on experience in identifying key insights from line graphs, such as detecting increases, decreases, and stable periods. The course will also cover advanced topics, such as comparing multiple data sets within a single graph and understanding the implications of various data patterns. By the end of this course, you will have the skills necessary to effectively use line graphs for data analysis, enabling you to make informed decisions based on visual data representations. This course is ideal for students, professionals, and anyone interested in enhancing their data analysis capabilities through the use of line graphs.
Focus on Learning, Not Ads
Experience the full power of Mindluster with Premium.
No distractions, just pure education.
Cancel your subscription anytime
