


Balaji kumar
Good
 (159 reviews)
 3 Lessons
 17 Students
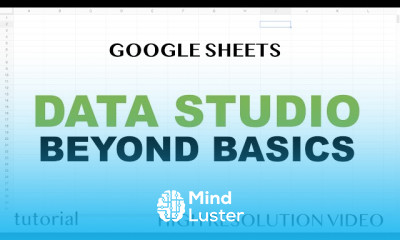
Google data studio techniques course, in this course we will learn about the advanced techniques of Google Data Studio, a powerful and free data visualization tool by Google that transforms your raw data into informative, easy-to-understand reports and dashboards. Google Data Studio allows you to connect multiple data sources, including Google Analytics, Google Sheets, SQL databases, and more, enabling you to create comprehensive and interactive reports. Throughout this course, you will start by understanding the basics of Google Data Studio, including its interface, key features, and functionalities. You will learn how to connect various data sources, blend data from different sources, and use built-in templates to speed up your report creation process. We will delve into designing and customizing your reports, utilizing various charts, graphs, and interactive elements to present your data effectively. Additionally, the course will cover advanced topics such as creating calculated fields, setting up filters and controls, and using data blending to combine insights from multiple data sets. You will also learn to apply advanced data transformation techniques and incorporate real-time data updates into your reports. By the end of this course, you will be able to create dynamic and visually appealing dashboards that can be shared with stakeholders and updated in real-time. This course is ideal for data analysts, marketers, business professionals, and anyone looking to enhance their data visualization skills. Whether you are a beginner or have some experience with data tools, this course will provide you with the knowledge and skills to leverage Google Data Studio for insightful and impactful data reporting.
 To Register in Course you have to watch at least 30 Second of any lesson
 Create interactive dashboards using Google Data Studio for effective data visualization and reporting
Connect and blend multiple data sources like Google Analytics, Sheets, and SQL databases seamlessly
Design customized reports with charts, graphs, and filters to enhance data insights and storytelling
Apply advanced techniques such as calculated fields, data blending, and real-time updates for dynamic reports
3 Lessons • 59 m total
You must have an
Account
on the platform.
Complete all lessons.
Watch at least 50% of Lesson Duration.
Get your Certificate free 🎉 !
4.4
(159 reviews)
Overall rating

Be the First One Review This Course
Good

Good
K
Good

Great

Good

thanks
Nothing

Google data studio techniques course, in this course we will learn about the advanced techniques of Google Data Studio, a powerful and free data visualization tool by Google that transforms your raw data into informative, easy-to-understand reports and dashboards. Google Data Studio allows you to connect multiple data sources, including Google Analytics, Google Sheets, SQL databases, and more, enabling you to create comprehensive and interactive reports. Throughout this course, you will start by understanding the basics of Google Data Studio, including its interface, key features, and functionalities. You will learn how to connect various data sources, blend data from different sources, and use built-in templates to speed up your report creation process. We will delve into designing and customizing your reports, utilizing various charts, graphs, and interactive elements to present your data effectively. Additionally, the course will cover advanced topics such as creating calculated fields, setting up filters and controls, and using data blending to combine insights from multiple data sets. You will also learn to apply advanced data transformation techniques and incorporate real-time data updates into your reports. By the end of this course, you will be able to create dynamic and visually appealing dashboards that can be shared with stakeholders and updated in real-time. This course is ideal for data analysts, marketers, business professionals, and anyone looking to enhance their data visualization skills. Whether you are a beginner or have some experience with data tools, this course will provide you with the knowledge and skills to leverage Google Data Studio for insightful and impactful data reporting.
Experience the full power of Mindluster with Premium.
No distractions, just pure education.
Cancel your subscription anytime