
Financial analysis with power BI Course

4.3 (183 reviews)
  • 32 Lessons
  • 1.2K Students
  • Certificate of completion

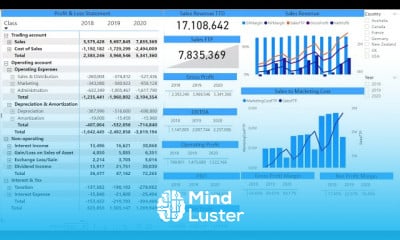
Financial analysis with power BI course, in this course designed to teach you how to harness the power of Power BI for effective financial analysis. We will start by introducing the fundamentals of Power BI, including data importation, cleaning, and transformation. You'll learn how to create dynamic and interactive dashboards and reports that offer valuable insights into financial data. The course covers key aspects such as building financial models, visualizing performance metrics, and conducting detailed budgeting and forecasting analyses. By the end of this course, you'll be adept at using Power BI to analyze financial data, identify trends, and make informed decisions based on clear, actionable insights. This course is ideal for finance professionals looking to enhance their analytical skills and leverage data visualization tools to drive financial strategy and performance.

To Register in Course you have to watch at least 30 Second of any lesson

What You'll Learn

  • Master financial data import, cleaning, and transformation using Power BI for accurate analysis
  • Create interactive dashboards and reports to visualize financial performance metrics effectively
  • Build comprehensive financial models to support budgeting, forecasting, and strategic decision-making
  • Analyze financial trends and patterns to identify key insights and improve business performance
  • Utilize Power BI features to conduct detailed variance analysis and financial scenario planning
  • Apply data visualization techniques to communicate complex financial data clearly and persuasively
  • Integrate multiple financial data sources for consolidated analysis and reporting
  • Leverage Power BI's DAX functions to perform advanced calculations and financial metrics
  • Develop customized financial reports that support stakeholder decision-making processes
  • Enhance financial analysis skills with Power BI to drive data-driven financial strategies

Course Content

32 Lessons • 4 h 7 m total

Financial Reporting Financial Analysis with Power BI Course Introduction

3:12

Lecture 1 Understanding data and download data files

4:27

Lecture 2 Importing data to Power BI

12:48

Lecture 3 Calculating Sales

8:34

Lecture 4 Formatting Matrix Course Power BI for Financial Reporting Financial Analysis

4:27

Lecture 5 Drill up and drill down data Course Financial Reporting Analysis with Power BI

5:01

Lecture 6 Visualizing Sales Course Financial Reporting Financial Analysis with Power BI

7:51

Lecture 7 Adding slicers Course Financial Reporting Analysis with Power BI

3:31

Lecture 8 Preparing Profit Loss Statement in Power BI Course Financial Analysis w Power BI

9:16

Lecture 9 Calculate Gross Profit Net Profit Course Financial Reporting Analysis w Power BI

16:51

Lecture 10 Using Card to present values Course Financial Reporting Analysis with Power BI

5:16

Lecture 11 Using KPI Course Financial Reporting Analysis with Power BI

6:07

Lecture 12 Date slicers and TTD value Course Financial Reporting Analysis with Power BI

2:45

Lecture 13 Adding basic P L visuals Course Financial Reporting Analysis with Power BI

11:04

Lecture 14 Comparing countries Course Financial Reporting Analysis with Power BI

7:58

Lecture 15 Moving to DAX Course Financial Reporting Analysis with Power BI

0:38

Lecture 16 Introduction to DAX Course Financial Reporting Analysis with Power BI

3:53

Lecture 17 Sum for the period Course Financial Reporting Analysis with Power BI

8:26

Lecture 18 Calculating Gross Profit with DAX Course Financial Reporting Analysis w Power BI

10:37

Lecture 19 Calculating Net Profit with DAX Course Financial Reporting Analysis with Power BI

4:33

Lecture 20 DAX Calculate with OR Operating Profit Course Financial Reporting Analysis w PBI

4:52

Lecture 21 Alternate way to Operating Profit Course Financial Reporting Analysis with Power BI

4:24

Lecture 22 Calculating EBITDA Course Financial Reporting Analysis with Power BI

3:44

Lecture 23 Calculating PBIT Course Financial Reporting Analysis with Power BI

4:31

Lecture 24 Visualizing Sales Gross Net Profit Course Financial Reporting Analysis with PBI

5:06

Lecture 25 Adding small multiples in chart Course Financial Reporting Analysis with Power BI

1:48

Lecture 26 Marketing Cost to Sales Course Financial Reporting Analysis with Power BI

8:07

Lecture 27 Calculate Gross Net Profit Margin Course Financial Reporting Analysis w Power BI

7:46

Working with Fiscal Financial Year that is different from Calendar Year Power BI

35:27

Converting two column debit credit General Ledger or TB to One column positive negative

13:14

Converting Single Column Positive Negative values GL to Debit Credit Power BI

6:28

Creating a Foolproof Sorting System for Income Statement and Balance Sheet in Power BI powerbi

15:04

How to Get The Certificate

  • You must have an Account on the platform.
  • Complete all lessons.
  • Watch at least 50% of Lesson Duration.
  • Get your Certificate free 🎉 !

Certificate Example

Mind Luster Certificate Template

4.3 (183 reviews)

Overall rating

  • 5.0 48%
  • 4.0 40%
  • 3.0 9%
  • 2.0 1%
  • 1.0 2%

Reviews

Rohit Kumar

· 2w ago

Learn with happyness

Suraj Debnath

· 2w ago

Great

Adekunle Anthony SANWO

· 3w ago

The training is straight to the point and well explained

Tarun Goyal

· 1mo ago

Good

Kunal Daikar

· 2mos ago

course was good

Mustapha Atbir

· 2mos ago

good

Alvin Zulfafa

· 3mos ago

Nice

Madhavendra Srivastava

· 3mos ago

exciting course , good for basics

Tharel Jal

· 3mos ago

great!

ACHABOU YOUNES

· 4mos ago

thank you

Yashwanth MS

· 5mos ago

.

Aashvi Bawse

· 6mos ago

made it easy

Financial analysis with power BI Course Description

Financial analysis with power BI course, in this course designed to teach you how to harness the power of Power BI for effective financial analysis. We will start by introducing the fundamentals of Power BI, including data importation, cleaning, and transformation. You'll learn how to create dynamic and interactive dashboards and reports that offer valuable insights into financial data. The course covers key aspects such as building financial models, visualizing performance metrics, and conducting detailed budgeting and forecasting analyses. By the end of this course, you'll be adept at using Power BI to analyze financial data, identify trends, and make informed decisions based on clear, actionable insights. This course is ideal for finance professionals looking to enhance their analytical skills and leverage data visualization tools to drive financial strategy and performance.

Focus on Learning, Not Ads

Experience the full power of Mindluster with Premium.
No distractions, just pure education.

Get Mindluster Premium

Cancel your subscription anytime

Course Intro