

Shekhar Meena
THIS COURSE IS HELPFUL TO UNDERSTAND MATLAB CONCEPT
 (44 reviews)
 12 Lessons
 312 Students
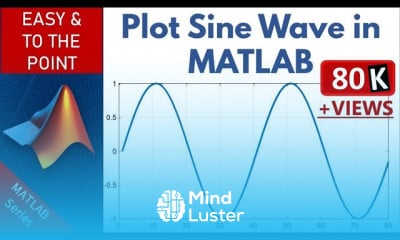
MATLAB Plotting basics course, in this course you will learn the fundamental techniques for creating visual representations of data using MATLAB. The course begins with an introduction to MATLAB's plotting functions, covering essential commands for generating 2D and 3D plots. You will explore how to customize your plots with labels, legends, and titles, enhancing the clarity and effectiveness of your visualizations. Additionally, you'll gain insights into various types of plots, including line graphs, scatter plots, bar charts, and histograms, allowing you to choose the most suitable type for your data. Throughout the course, hands-on exercises will help reinforce your learning, enabling you to apply these skills to real-world scenarios. By the end of the course, you will have a solid understanding of MATLAB's plotting capabilities, empowering you to present your data in a visually appealing and informative manner. Join us to unlock the power of data visualization in MATLAB.
 To Register in Course you have to watch at least 30 Second of any lesson
 Create 2D and 3D plots in MATLAB for effective data visualization and analysis
Customize MATLAB plots with labels, legends, and titles to improve clarity and presentation quality
Generate various plot types such as line graphs, scatter plots, bar charts, and histograms for diverse data sets
Apply MATLAB plotting functions to visualize real-world data and interpret results accurately
Enhance plot readability by adjusting colors, markers, line styles, and axes properties in MATLAB
Implement best practices for designing clear and informative data visualizations in MATLAB
Utilize MATLAB plotting tools to compare data trends and identify patterns visually
Develop practical skills to communicate data insights effectively through MATLAB visualizations
12 Lessons • 1 h 17 m total
 You must have an
Account
on the platform.
Complete all lessons.
Watch at least 50% of Lesson Duration.
Get your Certificate free 🎉 !
4.4
(44 reviews)
Overall rating

Be the First One Review This Course
THIS COURSE IS HELPFUL TO UNDERSTAND MATLAB CONCEPT

Excellent

It was very good for me and very helpful. Also, I learned lot of things from the course. Thank you.

Awesome

good for me

good course for MATLAB plotting

Good
.

Good

Good

Good

Good

MATLAB Plotting basics course, in this course you will learn the fundamental techniques for creating visual representations of data using MATLAB. The course begins with an introduction to MATLAB's plotting functions, covering essential commands for generating 2D and 3D plots. You will explore how to customize your plots with labels, legends, and titles, enhancing the clarity and effectiveness of your visualizations. Additionally, you'll gain insights into various types of plots, including line graphs, scatter plots, bar charts, and histograms, allowing you to choose the most suitable type for your data. Throughout the course, hands-on exercises will help reinforce your learning, enabling you to apply these skills to real-world scenarios. By the end of the course, you will have a solid understanding of MATLAB's plotting capabilities, empowering you to present your data in a visually appealing and informative manner. Join us to unlock the power of data visualization in MATLAB.
Experience the full power of Mindluster with Premium.
No distractions, just pure education.
Cancel your subscription anytime