


Md Zaheer Hasnain
nnn
 (1 review)
 12 Lessons
 20 Students
matplotlib is the O.G. of Python data visualization libraries. Despite being over a decade old, it's still the most widely used library for plotting in the Python community. It was designed to closely resemble MATLAB, a proprietary programming language developed in the 1980s .
 To Register in Course you have to watch at least 30 Second of any lesson
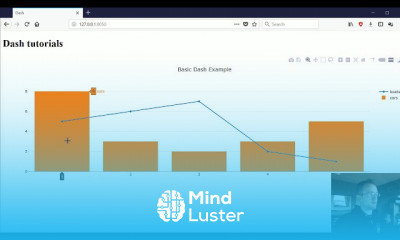
 Create interactive dashboards using Dash for real-time data visualization and analysis in Python
Design custom data visualization GUIs with Dash to enhance user engagement and data storytelling
Implement advanced plotting techniques in Dash to visualize complex datasets effectively
Optimize Dash applications for performance, scalability, and user experience in data visualization projects
Integrate Dash with other Python data analysis tools like pandas and NumPy for comprehensive insights
Build responsive and accessible data visualization interfaces suitable for diverse devices and users
Troubleshoot common issues in Dash GUIs to ensure reliable and accurate data presentation
Apply best practices for designing intuitive and visually appealing data visualization dashboards
12 Lessons • 3 h 19 m total
 You must have an
Account
on the platform.
Complete all lessons.
Watch at least 50% of Lesson Duration.
Get your Certificate free 🎉 !
5.0
(1 review)
Overall rating

Be the First One Review This Course
nnn
i feel so awesome to have completed this course

matplotlib is the O.G. of Python data visualization libraries. Despite being over a decade old, it's still the most widely used library for plotting in the Python community. It was designed to closely resemble MATLAB, a proprietary programming language developed in the 1980s .
Experience the full power of Mindluster with Premium.
No distractions, just pure education.
Cancel your subscription anytime