
 6 Lessons
 9 Students


Yakubu Akuyinga Shaibu
Gracias
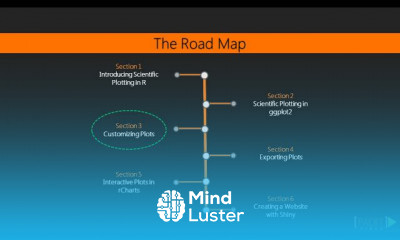
In R, we can create visually appealing data visualizations by writing few lines of code. For this purpose, we use the diverse functionalities of R. Data visualization is an efficient technique for gaining insight about data through a visual medium.
 To Register in Course you have to watch at least 30 Second of any lesson
 Create compelling data visualizations in R using ggplot2, base R, and lattice libraries for effective data analysis
Apply R programming skills to generate bar charts, scatter plots, histograms, and line graphs for diverse datasets
Utilize R's data manipulation and visualization tools to identify trends, patterns, and outliers in data sets
Design customized visualizations in R to communicate insights clearly and enhance data storytelling
Implement best practices for data visualization in R to improve clarity, accuracy, and visual appeal
Troubleshoot common issues in R data visualization to ensure accurate and professional graphical outputs
6 Lessons • 24 m total
 You must have an
Account
on the platform.
Complete all lessons.
Watch at least 50% of Lesson Duration.
Get your Certificate free 🎉 !
4.1
 (84 reviews)
Overall rating

Be the First One Review This Course
Gracias

That course provides basic knowledge of data visualization and prepare for the website design including of the type of images vector base and pixel base and i think it is the best way to explain some basic knowledge about R language

Nice

excellent
good

In R, we can create visually appealing data visualizations by writing few lines of code. For this purpose, we use the diverse functionalities of R. Data visualization is an efficient technique for gaining insight about data through a visual medium.
Experience the full power of Mindluster with Premium.
No distractions, just pure education.
Cancel your subscription anytime