Creating Data Visualization with D3 Course

 (168 reviews)
-
 5 Lessons
-
 2 Students
- Certificate of completion


D3 or Data-Driven Documents is an open-source JavaScript library and is undoubtedly the most influential tool for creating custom interactive data visualizations in the web browser using SVG, HTML and CSS .
 To Register in Course you have to watch at least 30 Second of any lesson
What You'll Learn
-
 Create interactive data visualizations using D3.js, SVG, HTML, and CSS for web-based data storytelling and analysis
-
Design custom charts and graphs with D3.js to enhance data comprehension and presentation skills
-
Implement dynamic data binding and updates in D3 visualizations for real-time data interaction
-
Optimize D3 visualizations for performance, accessibility, and cross-browser compatibility in web development
Course Content
5 Lessons • 47 m total

Creating Data Visualization with D3 The Course Overview |packtpub com
Creating Data Visualization with D3 Visualizing with Donut Chart|packtpub com
Creating Data Visualization with D3 Normal Tree Visualization |packtpub com
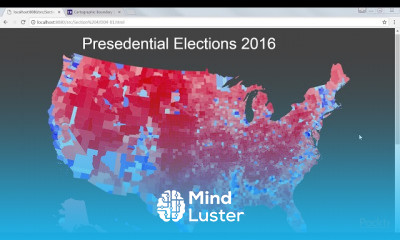
Creating Data Visualization with D3 Elections 2016 Choropleth |packtpub com
Creating Data Visualization with D3 Using D3 with ES6|packtpub com
How to Get The Certificate
-
You must have an
Account
on the platform.
-
Complete all lessons.
-
Watch at least 50% of Lesson Duration.
-
Get your Certificate free 🎉 !
4.4
(168 reviews)
Overall rating

Reviews
Be the First One Review This Course
Related Courses
View All














Creating Data Visualization with D3 Course Description
D3 or Data-Driven Documents is an open-source JavaScript library and is undoubtedly the most influential tool for creating custom interactive data visualizations in the web browser using SVG, HTML and CSS .
Focus on Learning, Not Ads
Experience the full power of Mindluster with Premium.
No distractions, just pure education.
Get Mindluster Premium
Cancel your subscription anytime
