
 16 Lessons
 24 Students



SHAMAIUN KABIR BHUIYAN
QUITE HELPFUL/
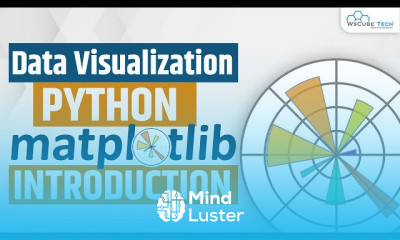
python matplotlib course in hindi, in this course Master data visualization with Matplotlib in Python, covering plotting techniques and customization
 To Register in Course you have to watch at least 30 Second of any lesson
 Create various types of plots using Python Matplotlib for effective data visualization and analysis
Customize plot styles, labels, titles, and legends to enhance visual appeal and clarity in Python
Implement advanced plotting techniques like subplots, histograms, and scatter plots in Matplotlib
Apply color schemes, markers, and line styles to improve the readability of data visualizations
Utilize Matplotlib functions to visualize large datasets and identify trends or patterns
Troubleshoot common issues in Python Matplotlib plots for seamless data presentation
Integrate Matplotlib visualizations into Python data analysis workflows and reports
Develop interactive and publication-quality visualizations for professional data storytelling
16 Lessons • 4 h 25 m total
 You must have an
Account
on the platform.
Complete all lessons.
Watch at least 50% of Lesson Duration.
Get your Certificate free 🎉 !
4.5
 (142 reviews)
Overall rating

Be the First One Review This Course
QUITE HELPFUL/

python matplotlib course in hindi, in this course Master data visualization with Matplotlib in Python, covering plotting techniques and customization
Experience the full power of Mindluster with Premium.
No distractions, just pure education.
Cancel your subscription anytime