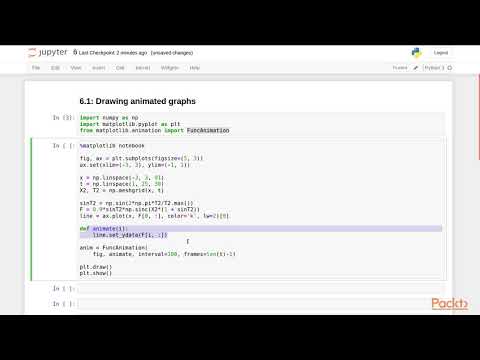
Data Visualization Recipes with Python and Matplotlib 3 Drawing Animated Graphs | packtpub com
Share your inquiries now with community members
Click Here
Sign up Now
Lessons List | 7
Lesson
Comments
Our New Certified Courses Will Reach You in Our Telegram Channel
Join Our Telegram Channels to Get Best Free Courses
Join Now
We Appreciate Your Feedback
2 Reviews

Sudha Shree

Ronaldo Shorts video
Show More Reviews
Related Courses in Programming


Course Description
Matplotlib is a cross-platform, data visualization and graphical plotting library for Python and its numerical extension NumPy. As such, it offers a viable open source alternative to MATLAB. Developers can also use matplotlib's APIs (Application Programming Interfaces) to embed plots in GUI applications .
Trends
Python programming language
MS Excel
Learning English Speaking
les dictionnaires en python
Insérer des flèches dans photoshop
French
Marketing digital
Formation efficace à l écoute de l
Fondamentaux de l intelligence artificielle
Installer ubuntu sur virtualBox
Make money with openAI GPTs
Digital Marketing From Scratch
ADCA Diploma for Advanced
Python Crash Basics
l anglais
French language for beginners
WordPress Complete Course in Hindi
Embedded Systems ES
Installation de mySQL
Bases de la PHP
Recent
Installer ubuntu sur virtualBox
les dictionnaires en python
les variables en PHP
Comprendre l héritage en POO python
Les fichiers CSV en python
Exercices corrigés en python
Les variables et types en python
Constructeur en PHP orienté objet
Bases de la PHP
Algorithmes de tri
Les fonctions en Algorithmie
Algorithmes sur les graphes
Algorithmes sur les tableaux
variables en programmation python
algorithmes et mathématiques
programmation shell windows
Bases de la conception UML
Installation de mySQL
Codage affine
les fonctions upper et lower