


Om Suryavanshi
nice
 (189 reviews)
 83 Lessons
 112 Students
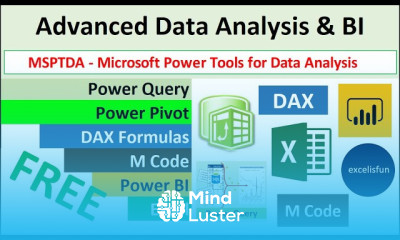
Power tools for data analysis course, in this course you'll explore a suite of advanced features and functionalities within Microsoft Excel designed to enhance your data analysis capabilities. Starting with an overview of these powerful tools, you'll delve into techniques for data manipulation, visualization, and modeling. Through hands-on tutorials and practical exercises, you'll learn how to leverage Power Query for data extraction, transformation, and loading (ETL), Power Pivot for data modeling and analysis, and Power BI for interactive data visualization and reporting. Whether you're a beginner looking to expand your analytical toolkit or an experienced analyst seeking to streamline your workflow, this course equips you with the skills and knowledge to tackle complex data analysis tasks with confidence. By the end of the course, you'll be able to harness the full potential of Microsoft's Power Tools to extract actionable insights and drive informed decision-making in your organization.
 To Register in Course you have to watch at least 30 Second of any lesson
 Master advanced data manipulation techniques using Power Query in Excel for efficient data transformation and cleaning
Create dynamic data models with Power Pivot to analyze large datasets and establish relationships between data tables
Design interactive dashboards and reports with Power BI to visualize complex data insights effectively
Apply data analysis expressions (DAX) to perform sophisticated calculations and enhance data modeling capabilities
Automate repetitive data analysis tasks using Excel's Power Tools to improve workflow efficiency
Integrate Power Query, Power Pivot, and Power BI for seamless end-to-end data analysis and reporting solutions
Utilize Power BI's interactive features to explore data and uncover actionable insights for decision-making
Develop skills to extract, transform, and load data from multiple sources for comprehensive analysis
Implement best practices for data visualization to communicate findings clearly and impactfully
Optimize data analysis processes in Excel to handle large datasets with speed and accuracy
Leverage Power Tools to streamline data preparation, analysis, and reporting workflows in Excel
Enhance data-driven decision-making skills through practical application of Power Query, Power Pivot, and Power BI
Build customized dashboards that reflect real-time data updates for ongoing business insights
Gain confidence in using Microsoft Power Tools to solve complex data analysis challenges efficiently
83 Lessons • 29 h 45 m total

 You must have an
Account
on the platform.
Complete all lessons.
Watch at least 50% of Lesson Duration.
Get your Certificate free 🎉 !
4.7
(189 reviews)
Overall rating

Be the First One Review This Course
nice
nice

Power tools for data analysis course, in this course you'll explore a suite of advanced features and functionalities within Microsoft Excel designed to enhance your data analysis capabilities. Starting with an overview of these powerful tools, you'll delve into techniques for data manipulation, visualization, and modeling. Through hands-on tutorials and practical exercises, you'll learn how to leverage Power Query for data extraction, transformation, and loading (ETL), Power Pivot for data modeling and analysis, and Power BI for interactive data visualization and reporting. Whether you're a beginner looking to expand your analytical toolkit or an experienced analyst seeking to streamline your workflow, this course equips you with the skills and knowledge to tackle complex data analysis tasks with confidence. By the end of the course, you'll be able to harness the full potential of Microsoft's Power Tools to extract actionable insights and drive informed decision-making in your organization.
Experience the full power of Mindluster with Premium.
No distractions, just pure education.
Cancel your subscription anytime