



Ranjani Ranjani
Nice
 (41 reviews)
 5 Lessons
 25 Students
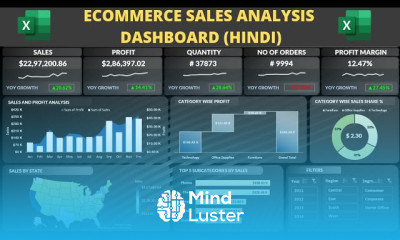
Excel dashboard essentials course, in this course you'll gain a solid foundation in creating powerful and interactive dashboards using Excel. We will start with the basics of data organization and then dive into key elements such as charts, pivot tables, and slicers that form the backbone of effective dashboards. You’ll learn how to design visually appealing dashboards that provide clear and actionable insights. The course will also cover techniques for automating data updates and integrating dynamic elements to enhance user interaction. By the end of this course, you’ll be equipped with the essential skills to build professional-grade dashboards that streamline data analysis and support informed decision-making. Join us to master the essentials of Excel dashboards and elevate your data visualization capabilities.
 To Register in Course you have to watch at least 30 Second of any lesson
 Create interactive Excel dashboards using charts, pivot tables, and slicers for data visualization and analysis
Design visually appealing dashboards that communicate insights clearly and effectively in Excel
Automate data updates and integrate dynamic elements to enhance dashboard interactivity and efficiency
Apply Excel dashboard techniques to streamline data analysis and support informed decision-making
5 Lessons • 32 m total
 You must have an
Account
on the platform.
Complete all lessons.
Watch at least 50% of Lesson Duration.
Get your Certificate free 🎉 !
4.3
(41 reviews)
Overall rating

Be the First One Review This Course
Nice
Very informative

Amazing course.

Excellent

Excel dashboard essentials course, in this course you'll gain a solid foundation in creating powerful and interactive dashboards using Excel. We will start with the basics of data organization and then dive into key elements such as charts, pivot tables, and slicers that form the backbone of effective dashboards. You’ll learn how to design visually appealing dashboards that provide clear and actionable insights. The course will also cover techniques for automating data updates and integrating dynamic elements to enhance user interaction. By the end of this course, you’ll be equipped with the essential skills to build professional-grade dashboards that streamline data analysis and support informed decision-making. Join us to master the essentials of Excel dashboards and elevate your data visualization capabilities.
Experience the full power of Mindluster with Premium.
No distractions, just pure education.
Cancel your subscription anytime