×
MindLuster Logo

Creating data bars in excel for beginners

Track :

Computer Softwares

Lessons no : 13

For Free Certificate After Complete The Course

To Register in Course you have to watch at least 30 Second of any lesson

Join The Course Go To Community Download Course Content

What will you learn in this course?
  • Create visually appealing data bars in Excel to enhance data visualization and comparison skills using conditional formatting techniques
  • Apply data bars to various datasets for financial analysis, sales reports, and performance metrics to identify trends and outliers effectively
  • Customize data bars by adjusting minimum and maximum values, colors, and fill options to suit specific data presentation needs
  • Utilize advanced techniques to manage and modify data bar rules, improving accuracy and clarity in data visualization
  • Implement step-by-step procedures for selecting cell ranges and applying data bars to streamline data analysis workflows
  • Differentiate between gradient and solid fill options to optimize visual impact and readability of data representations
  • Develop practical skills through hands-on exercises to confidently create and customize data bars in real-world datasets
  • Improve decision-making by leveraging data bars for quick insights, pattern recognition, and data-driven conclusions

How to Get The Certificate

  • You must have an account Register
  • Watch All Lessons
  • Watch at least 50% of Lesson Duration
  • you can follow your course progress From Your Profile
  • You can Register With Any Course For Free
  • The Certificate is free !
Lessons | 13


We Appreciate Your Feedback

Be the First One Review This Course

Excellent
0 Reviews
Good
0 Reviews
medium
0 Reviews
Acceptable
0 Reviews
Not Good
0 Reviews
0
0 Reviews

Alekhya Chelluri

Good platform very useful
2025-06-07

Our New Certified Courses Will Reach You in Our Telegram Channel
Join Our Telegram Channels to Get Best Free Courses

Join Now

Related Courses

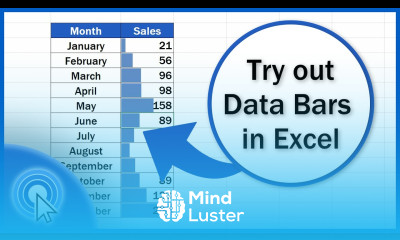
Creating data bars in excel course, 
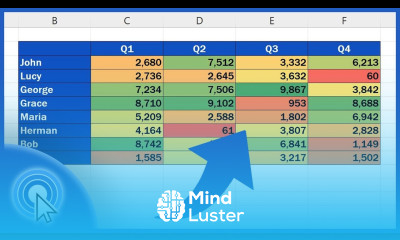
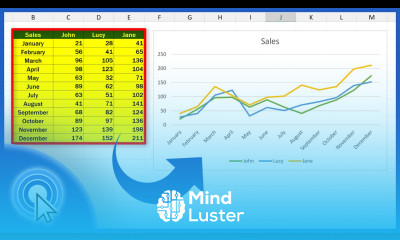
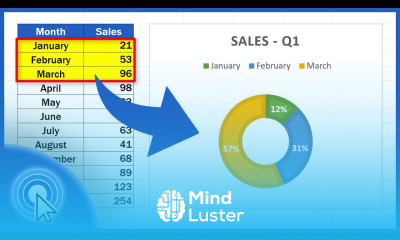
in this course we will learn about creating data bars in Excel, a powerful tool for visually representing numerical values within cells. Data bars provide an immediate and intuitive way to compare data points, making it easier to identify trends, patterns, and outliers in your datasets. You will start by understanding the basics of data bars and their applications in various scenarios such as financial analysis, sales reports, and performance metrics. We will guide you through the step-by-step process of applying data bars to your data ranges, including selecting the appropriate range of cells, accessing conditional formatting, and choosing between gradient and solid fill options. The course will also cover advanced customization techniques, such as adjusting the minimum and maximum values, changing colors, and managing rules for data bars. Hands-on exercises will provide practical experience, allowing you to apply these techniques to your own data sets confidently. By the end of this course, you will be proficient in creating and customizing data bars in Excel, enabling you to enhance your data visualization and make more informed decisions based on clear, visual comparisons. Whether you are a beginner or looking to refine your skills, this course will equip you with the knowledge and tools to master data bars in Excel, improving your overall productivity and data presentation capabilities.