

Mustafa Alizada
It was beneficial guidence.
 (181 reviews)
 3 Lessons
 10 Students
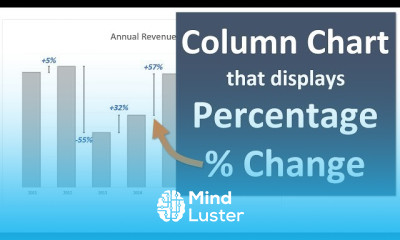
Excel for percentage change charts course, in this course we will delve into the techniques and tools needed to create and interpret percentage change charts in Excel. We will start by understanding the basics of calculating percentage changes, which is essential for comparing data points over time and identifying trends. You’ll learn how to set up your data correctly, ensuring accurate calculations and effective visualizations. We will cover various chart types suitable for displaying percentage changes, such as line charts, bar charts, and area charts, and show you how to customize these charts to highlight key insights. Through practical examples, you’ll discover how to use Excel formulas and functions, such as =(New Value - Old Value) / Old Value * 100, to calculate percentage changes. We will explore advanced techniques, including adding secondary axes, creating dynamic charts with data validation, and using conditional formatting to enhance your charts' readability. Hands-on exercises will provide you with the experience needed to apply these methods to real-world data sets, enabling you to transform raw data into clear, insightful visualizations.
 To Register in Course you have to watch at least 30 Second of any lesson
 Master how to calculate percentage change using Excel formulas and functions for accurate data analysis
Create and customize various percentage change charts, including line, bar, and area charts, for effective data visualization
Apply advanced techniques like secondary axes, data validation, and conditional formatting to enhance chart clarity and insights
Interpret percentage change charts to identify trends, compare data points, and communicate key insights effectively
3 Lessons • 27 m total
You must have an
Account
on the platform.
Complete all lessons.
Watch at least 50% of Lesson Duration.
Get your Certificate free 🎉 !
4.8
(181 reviews)
Overall rating

Be the First One Review This Course
It was beneficial guidence.

NICE
..

Good

Excel for percentage change charts course, in this course we will delve into the techniques and tools needed to create and interpret percentage change charts in Excel. We will start by understanding the basics of calculating percentage changes, which is essential for comparing data points over time and identifying trends. You’ll learn how to set up your data correctly, ensuring accurate calculations and effective visualizations. We will cover various chart types suitable for displaying percentage changes, such as line charts, bar charts, and area charts, and show you how to customize these charts to highlight key insights. Through practical examples, you’ll discover how to use Excel formulas and functions, such as =(New Value - Old Value) / Old Value * 100, to calculate percentage changes. We will explore advanced techniques, including adding secondary axes, creating dynamic charts with data validation, and using conditional formatting to enhance your charts' readability. Hands-on exercises will provide you with the experience needed to apply these methods to real-world data sets, enabling you to transform raw data into clear, insightful visualizations.
Experience the full power of Mindluster with Premium.
No distractions, just pure education.
Cancel your subscription anytime