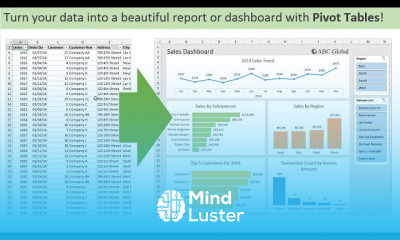
Using slicers in excel for Beginners Course

 (30 reviews)
-
 47 Lessons
-
 5 Students
- Certificate of completion


Using slicers in excel course, in this course we will delve into the world of Slicers in Excel, enhancing your ability to filter and present data interactively and clearly. Slicers are visual tools that allow you to filter data in pivot tables and regular tables in an easy and straightforward manner. You will learn how to insert, customize, and link Slicers to tables and pivot tables to achieve dynamic data display. The course will cover advanced techniques for using Slicers in designing interactive dashboards and performing effective data analysis. By the end of this course, you will be equipped to improve your reports and visual presentations using this powerful tool in Excel. Whether you are a beginner or looking to enhance your Excel skills, this course will provide you with the knowledge and confidence to start using Slicers in Excel today. Join us now and elevate your Excel proficiency with Slicers.
 To Register in Course you have to watch at least 30 Second of any lesson
What You'll Learn
-
 Create interactive Excel reports by inserting and customizing slicers for pivot and regular tables
-
Enhance data visualization skills using slicers to filter and display data dynamically in Excel dashboards
-
Link slicers to multiple tables and pivot tables for synchronized data filtering and analysis
-
Design user-friendly dashboards with slicers to improve data presentation and decision-making processes
-
Apply advanced slicer techniques to perform efficient data analysis and generate insightful reports
-
Customize slicer styles and layouts to match report themes and improve visual appeal in Excel
-
Utilize slicers to perform quick data segmentation for targeted analysis and reporting
-
Troubleshoot common slicer issues to ensure seamless data filtering and interactive Excel features
Course Content
47 Lessons • 5 h 41 m total

Introduction to Pivot Tables Charts and Dashboards in Excel Part 1
Introduction to Pivot Tables Charts and Dashboards Part 2
How to Create a Dashboard Using Pivot Tables and Charts in Excel Part 3
If The Field List Is Missing In Excel Here s How To Get It Back
How To Add A Search Box To A Slicer In Excel Learn How In This Quick Tutorial
How To Set Up A Slicer To Filter Another Slicer For Quick Navigation
Filter Pivot Tables For Month to date Mtd Comparisons With Slicers
How to Analyze Survey Data Part 3 Summarize with Pivot Tables and Charts
How to Analyze Survey Data Part 2 Unpivot Column of Comma Separated Values
How to Analyze Survey Data Part 1 Unpivot Data with Power Query
Excel 2010 Pivot Chart Formatting Makeover
Slicer Pivot Table Cache Relationship and the Filter Controls Error
3 Ways To Display Multiple Items In A Pivot Table Filter
Pivot Tables How To Change The Default From Count To Sum
MTD Pivot Table Calculation for Christopher
How to Remove or Replace Errors in Your Pivot Tables
Preview of PowerQuery Pivot Tables and Dashboards Video Series
The Quickest Way To Get Started With Pivotpal
Create a Distribution Chart Using PowerQuery and Pivot Tables
Use Pivot Tables to Create Montlhly Average vs Current Year Chart in Excel
How to Use Power Query to Unpivot Data for a Pivot Table
PivotPal Guide Build Modify Pivot Table from Source Data Sheet
PivotPal Guide Filter Source Data Sheet for Excel Pivot Table
PivotPal Guide Automatically Format Numbers in the Values Area of Excel Pivot Table
PivotPal Guide Search the Pivot Table Field List and Select Multiple Items
PivotPal Guide Search the Pivot Table Field List and Select Multiple Items
PivotPal Guide The Pivot Table Field List Selecting Multiple Items
Introduction to Pivot Tables Part 2
Intro to Pivot Tables
Compare Multiple Lists with a Pivot Table
3 Ways To Display Multiple Items In A Pivot Table Filter
3 Ways To Display Multiple Items In A Pivot Table Filter
3 Ways To Display Multiple Items In A Pivot Table Filter
3 Ways To Display Multiple Items In A Pivot Table Filter
Pivot Tables How To Change The Default From Count To Sum
How to Remove or Replace Errors in Your Pivot Tables
Preview of PowerQuery Pivot Tables and Dashboards Video Series
Compare Multiple Lists with a Pivot Table
How To Use Slicers in Excel User Guide for Beginners
Create Multiple Pivot Table Reports with Show Report Filter Pages

How to Get The Certificate
-
You must have an
Account
on the platform.
-
Complete all lessons.
-
Watch at least 50% of Lesson Duration.
-
Get your Certificate free 🎉 !
4.1
(30 reviews)
Overall rating

Reviews
Be the First One Review This Course
Related Courses
View All


















Using slicers in excel for Beginners Course Description
Using slicers in excel course, in this course we will delve into the world of Slicers in Excel, enhancing your ability to filter and present data interactively and clearly. Slicers are visual tools that allow you to filter data in pivot tables and regular tables in an easy and straightforward manner. You will learn how to insert, customize, and link Slicers to tables and pivot tables to achieve dynamic data display. The course will cover advanced techniques for using Slicers in designing interactive dashboards and performing effective data analysis. By the end of this course, you will be equipped to improve your reports and visual presentations using this powerful tool in Excel. Whether you are a beginner or looking to enhance your Excel skills, this course will provide you with the knowledge and confidence to start using Slicers in Excel today. Join us now and elevate your Excel proficiency with Slicers.
Focus on Learning, Not Ads
Experience the full power of Mindluster with Premium.
No distractions, just pure education.
Cancel your subscription anytime
