

Nurunnahar Mirza Kashem Mohila College
your course contribution is the best learning hubs for every concept clearance. thanks
 (2 reviews)
 11 Lessons
 36 Students
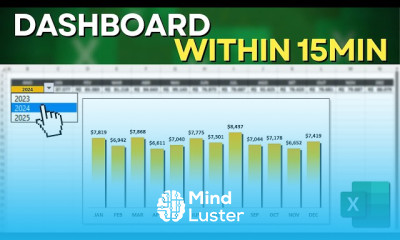
Building an interactive excel dashboard course, in this course we will delve into the process of building an interactive Excel dashboard. You will start by learning the fundamentals of data collection and organization, essential for creating a cohesive and effective dashboard. The course will guide you through the use of pivot tables and charts to visually represent your data in an engaging manner. We will explore the use of tools like Slicers and conditional formatting to enhance interactivity and user-friendliness. Additionally, you will learn how to link data from various sources and ensure your dashboard is automatically updated, keeping it relevant and accurate. By the end of this course, you will be proficient in designing and implementing interactive Excel dashboards that meet business needs and provide advanced data analysis. This hands-on training will equip you with the skills to create dynamic and visually appealing dashboards, transforming raw data into meaningful insights. Join us now to elevate your Excel expertise and master the art of building interactive dashboards.
 To Register in Course you have to watch at least 30 Second of any lesson
 Create dynamic Excel dashboards using pivot tables, charts, and slicers for effective data visualization and analysis
Implement data linking and automation techniques to ensure real-time updates in Excel dashboards
Apply conditional formatting to enhance dashboard interactivity and improve data readability in Excel
Design user-friendly interfaces for Excel dashboards that facilitate easy navigation and data exploration
Utilize advanced Excel functions to organize and analyze complex datasets for dashboard integration
Develop interactive dashboards that support business decision-making with meaningful insights
Customize Excel dashboards with visual elements to increase engagement and data comprehension
Troubleshoot common issues in Excel dashboards to maintain accuracy, functionality, and performance
11 Lessons • 7 h 31 m total
 You must have an
Account
on the platform.
Complete all lessons.
Watch at least 50% of Lesson Duration.
Get your Certificate free 🎉 !
5.0
(2 reviews)
Overall rating

Be the First One Review This Course
your course contribution is the best learning hubs for every concept clearance. thanks

.

Building an interactive excel dashboard course, in this course we will delve into the process of building an interactive Excel dashboard. You will start by learning the fundamentals of data collection and organization, essential for creating a cohesive and effective dashboard. The course will guide you through the use of pivot tables and charts to visually represent your data in an engaging manner. We will explore the use of tools like Slicers and conditional formatting to enhance interactivity and user-friendliness. Additionally, you will learn how to link data from various sources and ensure your dashboard is automatically updated, keeping it relevant and accurate. By the end of this course, you will be proficient in designing and implementing interactive Excel dashboards that meet business needs and provide advanced data analysis. This hands-on training will equip you with the skills to create dynamic and visually appealing dashboards, transforming raw data into meaningful insights. Join us now to elevate your Excel expertise and master the art of building interactive dashboards.
Experience the full power of Mindluster with Premium.
No distractions, just pure education.
Cancel your subscription anytime