Combining charts in excel for beginners Course

 (77 reviews)
-
 13 Lessons
-
 1 Students
- Certificate of completion


Combining charts in excel course, in this course we will explore the techniques for counting colored cells in Excel, a valuable skill for visually analyzing and categorizing data. Starting with the basics, we will cover how to utilize built-in Excel functions alongside creative solutions to count cells based on their colors. We will then delve into more advanced methods, including using VBA (Visual Basic for Applications) to create custom functions for precise color-based counting. Practical examples will illustrate how to apply these techniques to summarize and analyze data efficiently. By the end of this course, you will be equipped with the knowledge and skills to effectively count and analyze colored cells, enhancing your data analysis capabilities. Whether you are a beginner or an advanced user, this course will guide you step-by-step in mastering color counting techniques in Excel. Join us now to leverage the power of color in your data analysis and make more informed decisions based on visual data cues. Start your journey in learning about counting colors in Excel today and transform the way you handle data.
 To Register in Course you have to watch at least 30 Second of any lesson
What You'll Learn
-
 Master how to combine multiple charts in Excel for comprehensive data visualization and reporting
-
Apply techniques to create dynamic and interactive combined charts for better data analysis
-
Utilize Excel functions and VBA to customize and enhance combined chart features and appearance
-
Analyze complex datasets by integrating different chart types for clearer insights and decision-making
-
Implement best practices for formatting and designing combined charts to improve readability and impact
-
Troubleshoot common issues when merging charts in Excel to ensure accurate data representation
-
Leverage combined charts to compare and contrast data trends effectively across multiple datasets
-
Enhance presentation skills by creating professional, visually appealing combined charts for reports and dashboards
-
Use Excel tools to automate the process of combining charts for efficient data visualization workflows
-
Develop skills to interpret combined chart data accurately for strategic business decisions
-
Integrate combined charts into dashboards for real-time data monitoring and analysis
-
Gain confidence in creating, customizing, and presenting combined charts to communicate data insights effectively
Course Content
13 Lessons • 2 h 22 m total

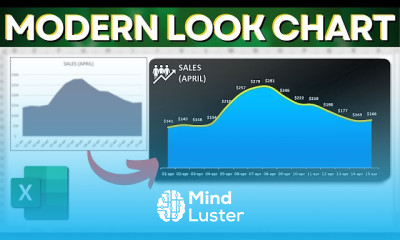
How to Create a Beautiful and Modern Look Chart in Excel Step by Step From Scratch
A Chart Within a Cell to Analyze a Large Dataset in Excel How to Make SparkLines
How to Make a Modern Looking Column Chart in Excel To use in Presentations
How to Make A Heat Map Chart in Excel The Best Chart to Analyze Multiple Datasets
How to Make a Modern Looking Column Chart in Excel To use in Presentations
How to Make a Dashboard in Excel Within 15 minutes Sumif Function and Text Function
Modern Line Area Chart in Excel How to Make a Beautiful Design Chart
How to Make a Beautiful and Modern Looking Excel Chart Practical Example 3 Models
How to Make a Actual vs Target Chart in Excel SumIF Function From Dataset to the Chart
How to Make a Progressive Donut Chart in Excel Automatic and Moderning Look Chart
How to Combine Charts in Excel Find Correlation Between Data Column Line Chart
How to Actual vs Target Excel Chart Interactive and Automatically Color Change
How To Excel Thermometer Chart That Changes Color Interactive Chart
How to Get The Certificate
-
You must have an
Account
on the platform.
-
Complete all lessons.
-
Watch at least 50% of Lesson Duration.
-
Get your Certificate free 🎉 !
4.3
(77 reviews)
Overall rating

Reviews
Be the First One Review This Course
Related Courses
View All


















Combining charts in excel for beginners Course Description
Combining charts in excel course, in this course we will explore the techniques for counting colored cells in Excel, a valuable skill for visually analyzing and categorizing data. Starting with the basics, we will cover how to utilize built-in Excel functions alongside creative solutions to count cells based on their colors. We will then delve into more advanced methods, including using VBA (Visual Basic for Applications) to create custom functions for precise color-based counting. Practical examples will illustrate how to apply these techniques to summarize and analyze data efficiently. By the end of this course, you will be equipped with the knowledge and skills to effectively count and analyze colored cells, enhancing your data analysis capabilities. Whether you are a beginner or an advanced user, this course will guide you step-by-step in mastering color counting techniques in Excel. Join us now to leverage the power of color in your data analysis and make more informed decisions based on visual data cues. Start your journey in learning about counting colors in Excel today and transform the way you handle data.
Focus on Learning, Not Ads
Experience the full power of Mindluster with Premium.
No distractions, just pure education.
Cancel your subscription anytime
