


Sathvikka P
Good
 (20 reviews)
 29 Lessons
 410 Students
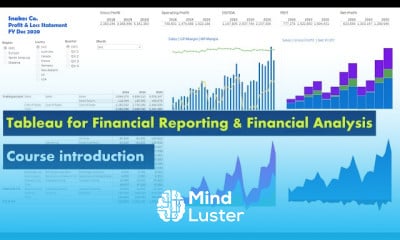
Tableau for financial reporting course, in this course we will learn about Tableau for financial reporting. You'll explore how to leverage Tableau’s powerful data visualization tools to transform complex financial data into clear, insightful reports and dashboards. The course covers key techniques for creating interactive financial reports, including building dynamic dashboards, visualizing key financial metrics, and integrating data from multiple sources. You’ll also learn how to automate the reporting process, ensuring that financial insights are always up-to-date and accessible. By mastering Tableau’s features, you’ll be able to present financial information in a way that enhances decision-making and supports strategic planning. This course is ideal for finance professionals, analysts, and anyone looking to improve their financial reporting skills using Tableau.
 To Register in Course you have to watch at least 30 Second of any lesson
 Create interactive financial dashboards that highlight key financial metrics and trends using Tableau visualization tools
Integrate and blend financial data from multiple sources to generate comprehensive reports in Tableau
Design dynamic reports that update automatically to reflect real-time financial data and insights
Apply best practices for visualizing complex financial data to enhance clarity and decision-making
Utilize Tableau features to automate financial reporting processes, saving time and reducing errors
Develop customized financial visualizations that communicate insights effectively to stakeholders
Analyze financial performance metrics through Tableau to identify patterns and support strategic planning
Implement advanced Tableau techniques to improve the accuracy and impact of financial reports
Optimize financial report layouts and visualizations for clarity, accessibility, and stakeholder engagement
Leverage Tableau’s interactivity features to create engaging, user-friendly financial dashboards
29 Lessons • 2 h 26 m total
 You must have an
Account
on the platform.
Complete all lessons.
Watch at least 50% of Lesson Duration.
Get your Certificate free 🎉 !
4.5
(20 reviews)
Overall rating

Be the First One Review This Course
Good

Very intersting

This course provided a strong foundation in Tableau and data visualization. The practical exercises and real-world examples made learning engaging and effective. I gained valuable skills in creating dashboards, analyzing data, and presenting insights. Overall, it was a great learning experience.
Good

It's beginner friendly . Mostly recommended for beginner .

Nice one but more sources is needed

ok

needs more researches
This course is very useful for my career

useful tool for future, great
fabulous

h

Tableau for financial reporting course, in this course we will learn about Tableau for financial reporting. You'll explore how to leverage Tableau’s powerful data visualization tools to transform complex financial data into clear, insightful reports and dashboards. The course covers key techniques for creating interactive financial reports, including building dynamic dashboards, visualizing key financial metrics, and integrating data from multiple sources. You’ll also learn how to automate the reporting process, ensuring that financial insights are always up-to-date and accessible. By mastering Tableau’s features, you’ll be able to present financial information in a way that enhances decision-making and supports strategic planning. This course is ideal for finance professionals, analysts, and anyone looking to improve their financial reporting skills using Tableau.
Experience the full power of Mindluster with Premium.
No distractions, just pure education.
Cancel your subscription anytime