Charts and graphs in excel
Computer Softwares
Another Computer Softwares Courses
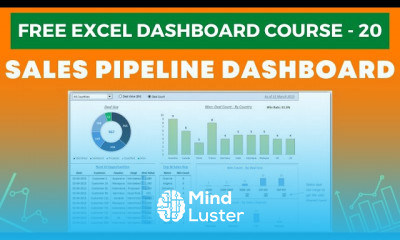
Charts and graphs in excel course, in this course designed to enhance your data visualization skills using Excel. Through practical demonstrations and hands-on exercises, you'll learn how to create, customize, and effectively utilize various types of charts and graphs to represent your data visually. Explore techniques for choosing the right chart type for different data sets, formatting charts to enhance clarity and visual appeal, and adding meaningful labels and titles. Whether you're a beginner or an experienced Excel user, this course provides invaluable insights into leveraging Excel's charting capabilities to communicate insights, trends, and patterns effectively. Join us as we delve into the world of charts and graphs in Excel and unlock the full potential of data visualization for your projects and presentations.


