Creating infographics in excel for beginners
Computer Softwares
Another Computer Softwares Courses
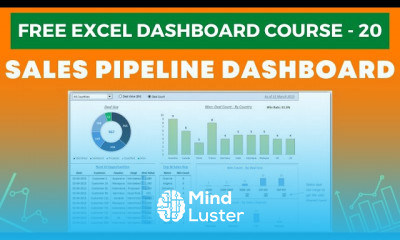
Creating infographics in excel course, in this course you'll learn how to leverage the capabilities of Excel to design visually captivating and informative infographics. We will begin by covering the fundamentals of data visualization and the essential principles of effective infographic design. You’ll explore how to use Excel’s charts, shapes, icons, and formatting tools to transform raw data into clear and compelling visual narratives. We'll delve into advanced techniques for customizing charts, incorporating images, and adding interactive elements to enhance your infographics. Additionally, you'll learn how to use color schemes and typography effectively to make your data stand out. By the end of this course, you'll be equipped with the skills to create professional-quality infographics in Excel that effectively communicate your data insights. Join us to master the art of creating engaging infographics in Excel and elevate your data presentation to new heights.


