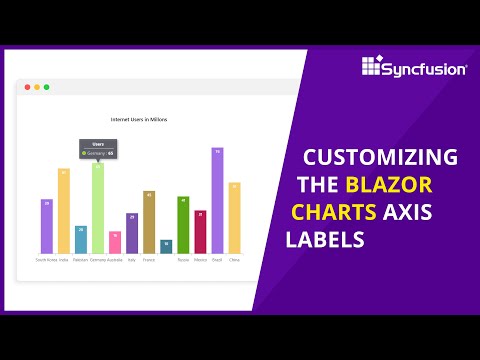
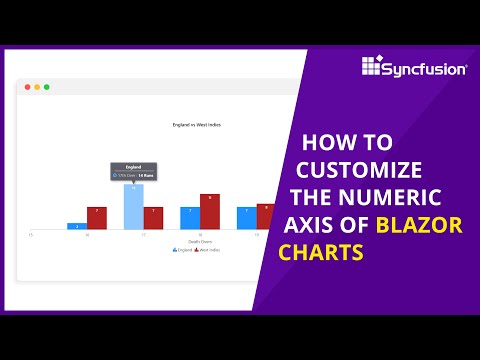
How to Customize the Numeric Axis of Blazor Charts
Share your inquiries now with community members Click Here
Sign up Now
Lessons List | 17 Lesson

Comments
Our New Certified Courses Will Reach You in Our Telegram Channel
Join Our Telegram Channels to Get Best Free Courses
Join Now
We Appreciate Your Feedback
Be the First One Review This Course
0 Reviews
Related Courses in Programming


Course Description
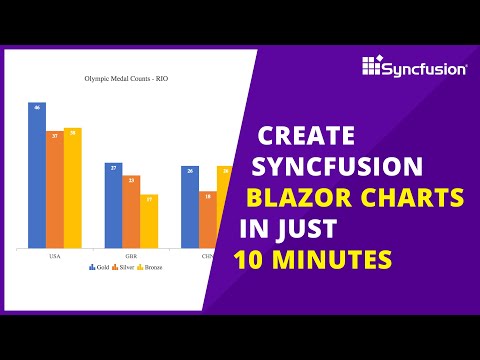
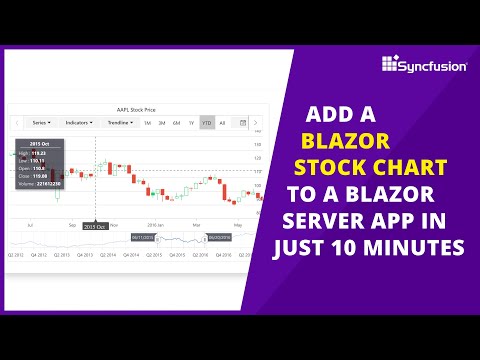
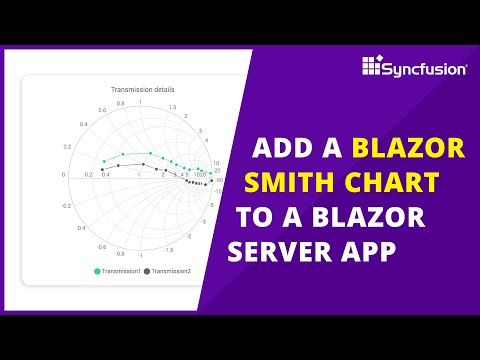
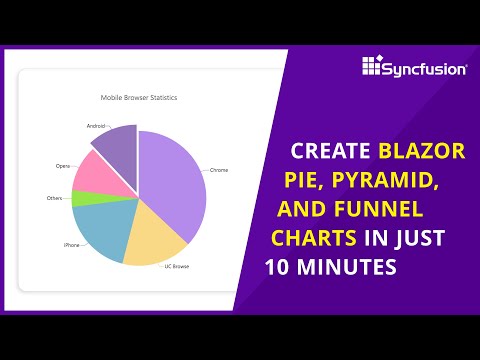
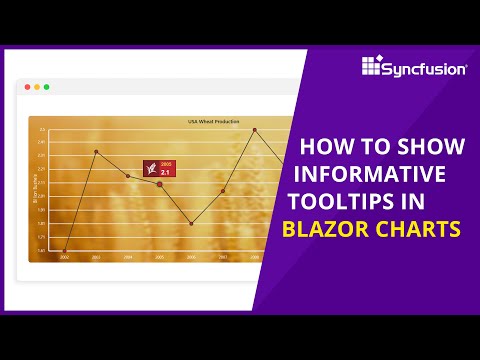
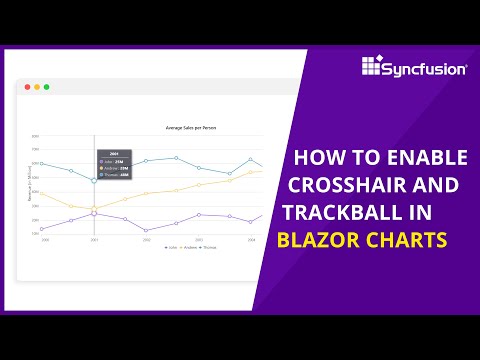
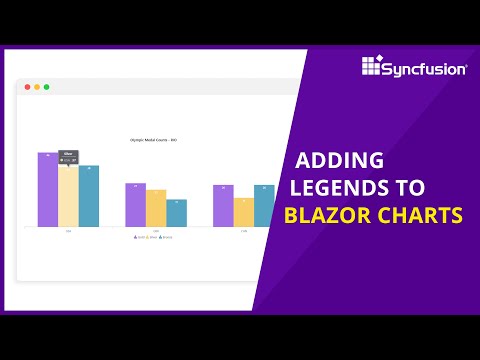
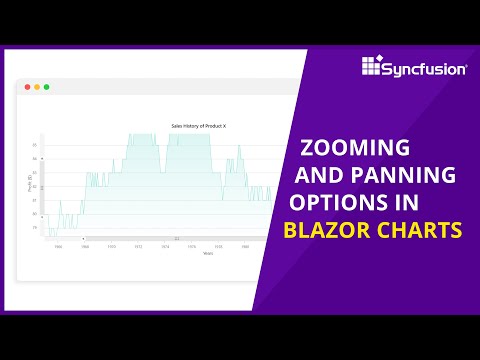
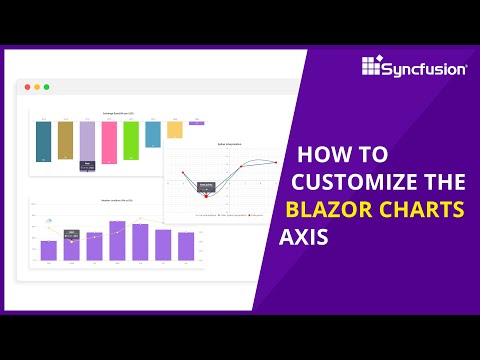
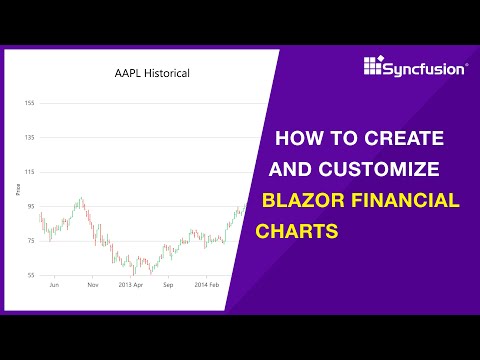
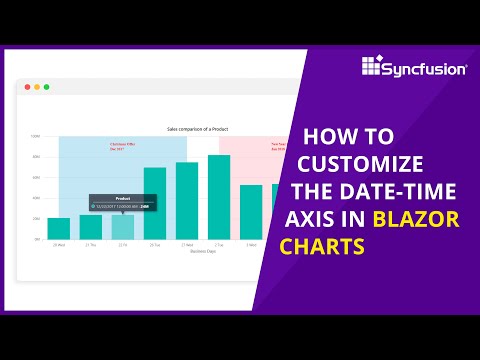
Blazor Charts is a well-crafted charting component to visualize data. It contains a rich UI gallery of 30+ charts and graphs, ranging from line to financial that cater to all charting scenarios. Its high performance helps render large amounts of data quickly.
Trends
MS Excel
Learning English Speaking
Excel Course Basic to Advanced
Blockchain development essentials for beginners
Types of networking for beginners
Python programming language
Pen tool skills in illustrator for beginners
Video Editing with Premiere Pro for beginner
Helical Springs Terms
Canva design basics for beginners
Digital Marketing
Communication Skills
English Speaking
Power in AC Circuit in Network Theory
Computer Hardware Repair Techniques
Bootstrap file structure essentials
Python string formatting essentials
Content types in instagram for beginner
Advanced Excel
English Grammar
Recent
Bootstrap file structure essentials
Pen tool skills in illustrator for beginners
Video Editing with Premiere Pro for beginner
Content types in instagram for beginner
Creating websites with elementor Pro for beginner
Creating Portfolio using wordPress and elementor
Creating a booking system with wordPress
Affiliate marketing essentials for beginner
Creating affiliate marketing website for beginner
WordPress theme development fundamentals for beginner
Typescript types for beginner
React Js features for beginner
Social media optimization techniques
Audio editing in adobe audition for beginners
Link building strategies for blogging
App store optimization strategies
Facebook ads audience types
Freelancing in digital marketing for beginners
Python string formatting essentials
Affiliate marketing programs for beginners