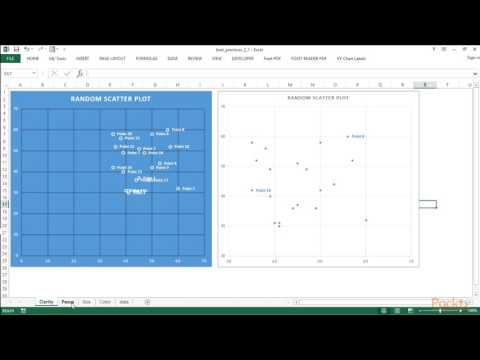
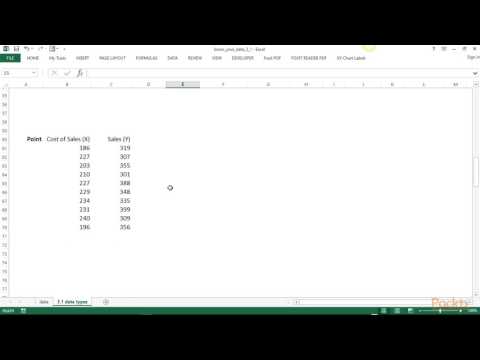
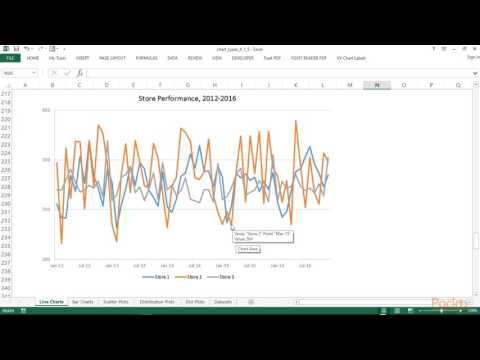
Learning Data Visualization Line Charts | packtpub com
Share your inquiries now with community members Click Here
Sign up Now
Lessons List | 4 Lesson

Comments
Our New Certified Courses Will Reach You in Our Telegram Channel
Join Our Telegram Channels to Get Best Free Courses
Join Now
We Appreciate Your Feedback
7 Reviews

B.Srilakshmi
P. Prathiksha

Fatimə Əlizadə
Pranay Patil
Show More Reviews
Related Courses in Programming


Course Description
Data visualization is the graphical representation of information and data. By using visual elements like charts, graphs, and maps, data visualization tools provide an accessible way to see and understand trends, outliers, and patterns in data.
Trends
Python programming language
MS Excel
Learning English Speaking
Excel Course Basic to Advanced
Financial Institutions management
Digital Marketing Hacks for beginner
Communication Skills
English Speaking
Photoshop text masking effect methods
English Language
Creating a microsoft word template for beginners
AI Ethics principles and governance
Network Theory basics for Beginners
Cloud Computing Arabic Course
Power BI
Employment Law
Digital Marketing
AutoCAD Techniques in Engineering Drawing
Design and Analysis of algorithms DAA
Communication Skills importance
Recent
Digital Marketing Hacks for beginner
Human Psychology
Bitcoin Cryptocurrency Knowledge
Technical Analysis for Beginners
Motivational Speech 2024
Talent platform operation guide
Artificial Intelligence AI new
Artificial Intelligence AI Arabic
Cloud Computing Arabic Course
Routing Switching
Security Course Revision
Access Network Arabic
Security Arabic
Routing Switching Arabic
iTB 3rd Annual Conference
Taking Exam Process 2023
AMAZON BOOK PUBLISHING MASTERY
ONLINE BUSINESS MASTERY
MOTIVATION INSPIRATION
MONEY INVESTING MASTERY