R Data Visualization BasicPlot Map PieChrt Intro ScttrPlot with Txt Lbl Line | packtpub com
Share your inquiries now with community members Click Here
Sign up Now
Lessons List | 5 Lesson
Comments
Our New Certified Courses Will Reach You in Our Telegram Channel
Join Our Telegram Channels to Get Best Free Courses
Join Now
We Appreciate Your Feedback
Be the First One Review This Course
0 Reviews
Related Courses in Programming


Course Description
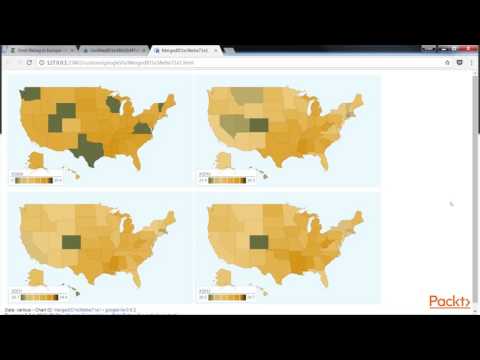
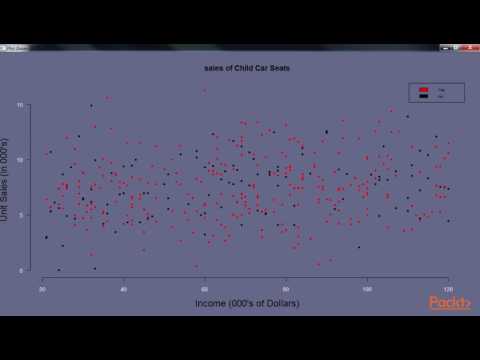
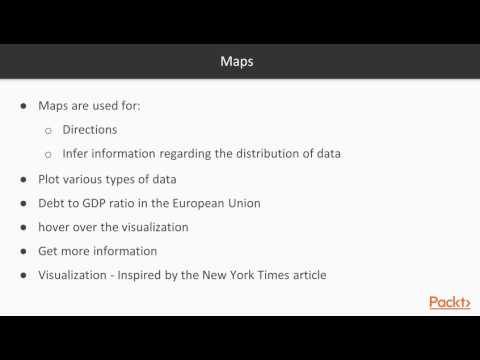
Data visualization is a technique used for the graphical representation of data. By using elements like scatter plots, charts, graphs, histograms, maps, etc., we make our data more understandable. Data visualization makes it easy to recognize patterns, trends .
Trends
MS Excel
Learning English Speaking
Video Editing with Premiere Pro for beginner
Pen tool skills in illustrator for beginners
Excel Course Basic to Advanced
Types of networking for beginners
Python string formatting essentials
Canva design basics for beginners
Python programming language
English Speaking
Communication Skills
English Grammar
E Commerce Business Fundamentals
C Programming language basics For beginners
AutoCAD 3D rendering techniques
Bootstrap file structure essentials
Graphic Design | Photoshop
Video Editing Techniques for beginners
Content types in instagram for beginner
English Grammar basics to Advanced
Recent
Bootstrap file structure essentials
Pen tool skills in illustrator for beginners
Video Editing with Premiere Pro for beginner
Content types in instagram for beginner
Creating websites with elementor Pro for beginner
Creating Portfolio using wordPress and elementor
Creating a booking system with wordPress
Affiliate marketing essentials for beginner
Creating affiliate marketing website for beginner
WordPress theme development fundamentals for beginner
Typescript types for beginner
React Js features for beginner
Social media optimization techniques
Audio editing in adobe audition for beginners
Link building strategies for blogging
App store optimization strategies
Facebook ads audience types
Freelancing in digital marketing for beginners
Python string formatting essentials
Affiliate marketing programs for beginners