SVG and Interactive Visualization in D3 Chart Them Up | packtpub com
Share your inquiries now with community members Click Here
Sign up Now
Lessons List | 7 Lesson
Comments
Our New Certified Courses Will Reach You in Our Telegram Channel
Join Our Telegram Channels to Get Best Free Courses
Join Now
We Appreciate Your Feedback
Be the First One Review This Course
0 Reviews
Related Courses in Programming


Course Description
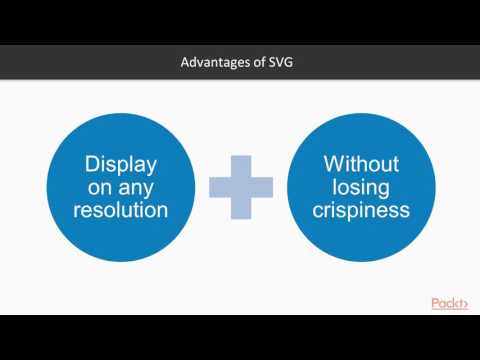
SVG stands for Scalable Vector Graphics. SVG is an XML-based vector graphics format. It provides options to draw different shapes such as Lines, Rectangles, Circles, Ellipses, etc. Hence, designing visualizations with SVG gives you more power and flexibility.
Trends
Python programming language
Excel Course Basic to Advanced
Learning English Speaking
Artificial Intelligence For Beginners
Photoshop text masking effect methods
AI Art generation tool techniques
MS Excel
Keyboard shortcuts for power users
Google sheets mCQ fundamentals
Digital Marketing Beginners
Mobile Apps from Scratch
String basics in Java
Computers skills
SQL Joins for beginners
Digital Marketing
Magento Formation Français
Motion blocks in scratch 3 0
C Programming for Beginners
Data Analytics with Excel
Big Data Analytics skills for beginners
Recent
AI Art generation tool techniques
Shopify Google Ads conversion tracking
ChatGPT Marketing Fundamentals
AI writing tools for content creation
Computer miscellaneous mCQ fundamentals
Google sheets mCQ fundamentals
Keyboard shortcuts for power users
Motion blocks in scratch 3 0
String basics in Java
Storage devices technologies
eShopping fundamentals for beginners
XML Document Structure
Malware types for beginners
CSS Custom Properties for beginners
Windows Operating System Fundamentals
CSS Selectors for web designers
SQL Joins for beginners
Computer mouse features and customization options
Microsoft Paint tools basics
Scripting in Scratch 3 0 for beginners