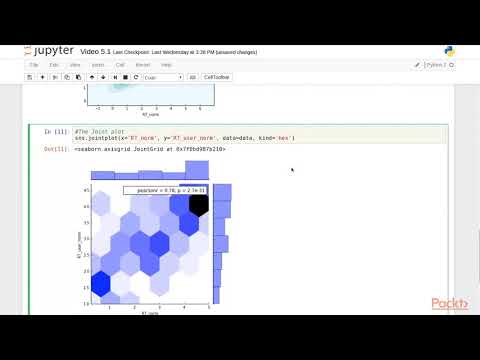
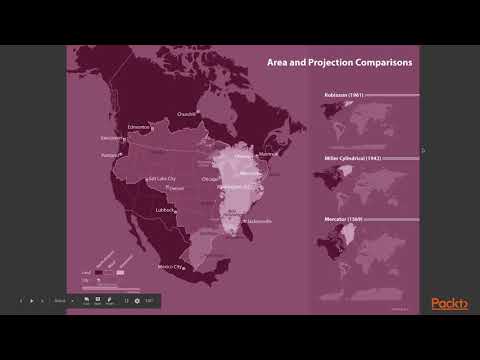
Learning Python Data Visualization Working with Latitudes Longitudes| packtpub com
Share your inquiries now with community members Click Here
Sign up Now
Lessons List | 6 Lesson
Comments
Our New Certified Courses Will Reach You in Our Telegram Channel
Join Our Telegram Channels to Get Best Free Courses
Join Now
We Appreciate Your Feedback
7 Reviews

rijwan khan
Favour Ifeanyichukwu George

Sakshi Bhosale
M. Kaleeswari
Show More Reviews
Related Courses in Programming


Course Description
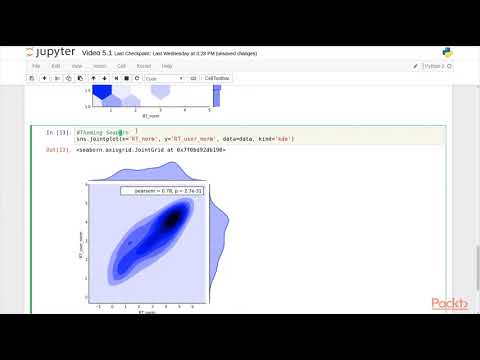
matplotlib is the O.G. of Python data visualization libraries. Despite being over a decade old, it's still the most widely used library for plotting in the Python community. It was designed to closely resemble MATLAB, a proprietary programming language developed in the 1980s .
Trends
Python programming language
MS Excel
Learning English Speaking
Excel Course Basic to Advanced
Communication Skills
English Speaking
Digital Marketing Hacks for beginner
IELTS
Photoshop text masking effect methods
Financial Institutions management
PowerPoint Presentation essentials
English Language
Digital Marketing
Power BI
Design and Analysis of algorithms DAA
Creating a microsoft word template for beginners
Cloud Computing Arabic Course
Communication Skills importance
Network Theory basics for Beginners
AI Ethics principles and governance
Recent
Digital Marketing Hacks for beginner
Human Psychology
Bitcoin Cryptocurrency Knowledge
Technical Analysis for Beginners
Motivational Speech 2024
Talent platform operation guide
Artificial Intelligence AI new
Artificial Intelligence AI Arabic
Cloud Computing Arabic Course
Routing Switching
Security Course Revision
Access Network Arabic
Security Arabic
Routing Switching Arabic
iTB 3rd Annual Conference
Taking Exam Process 2023
AMAZON BOOK PUBLISHING MASTERY
ONLINE BUSINESS MASTERY
MOTIVATION INSPIRATION
MONEY INVESTING MASTERY