Building Interactive Dashboards Microsoft Power BI Introducing Data Stories | packtpub com
Share your inquiries now with community members Click Here
Sign up Now
Lessons List | 6 Lesson


Comments
Our New Certified Courses Will Reach You in Our Telegram Channel
Join Our Telegram Channels to Get Best Free Courses
Join Now
We Appreciate Your Feedback
3 Reviews

Abubakar Sadiq Kole

Khaled al56ir
FRIDAH kimotho
Show More Reviews
Related Courses in Programming


Course Description
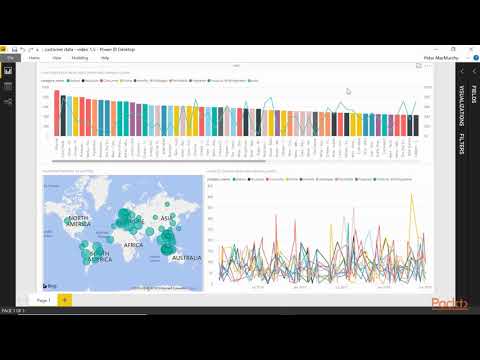
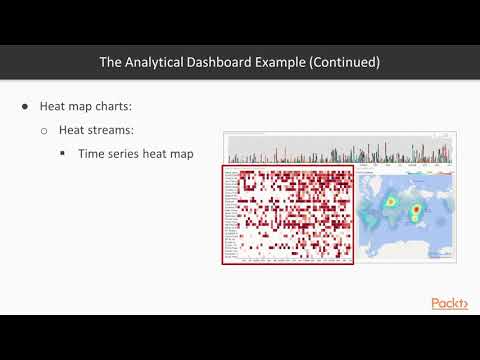
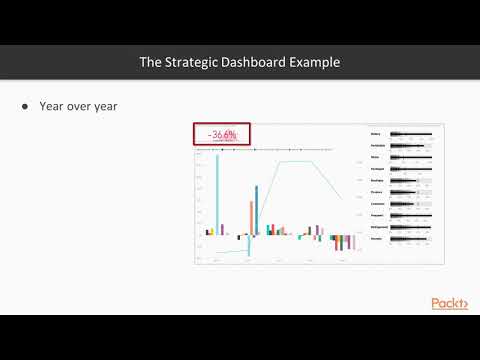
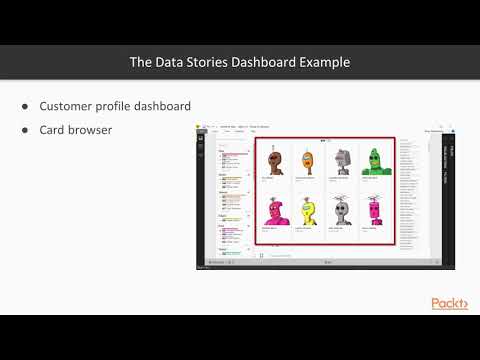
A Power BI dashboard is a single page, often called a canvas, that tells a story through visualizations. Because it's limited to one page, a well-designed dashboard contains only the highlights of that story. Readers can view related reports for the details. Dashboards are a feature of the Power BI service only .
Trends
English Speaking
Cybersecurity
Pen tool skills in illustrator for beginners
Mindfulness Meditations
excel countifs function essentials
Power Query installation essentials
Cryptocurrency fundamentals
Financial Ratio essentials
Business intelligence fundamentals
English Language
Guest post backlinks fundamentals
English Typing Skills
Build an App in React
Node JS Mongo DB
Data Science types and machine learning models
Artlantis 6 L essentiel
Affiliate marketing essentials for beginner
MS Excel
Python string formatting essentials
Adobe XD
Recent
Business intelligence fundamentals
Financial modeling with macabacus essentials
Descriptive statistics fundamentals
Power Query installation essentials
US Debt Ceiling basics
excel countifs function essentials
Cryptocurrency fundamentals
Financial Ratio essentials
Financial statement impact of buying equipment
using AI in Finance for beginner
Data Science types and machine learning models
Financial Partnership strategies
OSINT
GRC Practical Series
CISSP Prep Coffee Shots
CGRC
Ransomware Series
Application Security
Strengthening Cybersecurity Defenses
CompTIA Course for Cybersecurity Essentials