Python math module
Share your inquiries now with community members Click Here
Sign up Now
Lesson extensions
Lessons List | 32 Lesson


Comments
Our New Certified Courses Will Reach You in Our Telegram Channel
Join Our Telegram Channels to Get Best Free Courses
Join Now
We Appreciate Your Feedback
3 Reviews

ASHOKSHARMA C S
Lolla sandhya sri

rama samy
Show More Reviews
Related Courses in Computer Science


Course Description
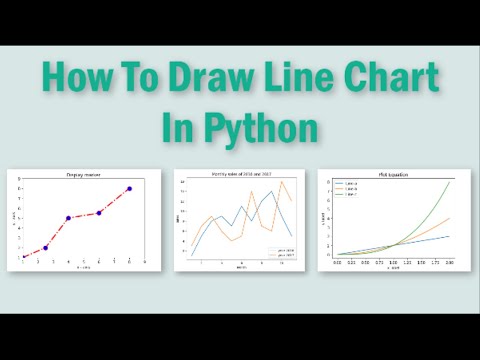
Python Line charts course,
in this course will explore the creation, customization, and analysis of line charts using Python. This course provides a comprehensive introduction to the fundamentals of data visualization with line charts in Python. Participants will learn how to plot data points, connect them with lines, and represent trends over time or across different variables. Through hands-on exercises and practical examples, learners will gain proficiency in customizing line charts to enhance visual clarity and effectiveness. Topics covered include manipulating data with libraries such as NumPy and Pandas, leveraging Matplotlib and Seaborn for plotting, and incorporating interactive features with Plotly. Additionally, participants will delve into advanced techniques for time series analysis, integrating multiple data sources, and best practices for presenting insights effectively. By the end of the course, participants will have the skills and confidence to create compelling line charts and leverage them to convey insights in various domains, including finance, science, and business intelligence.
Trends
Excel Course Basic to Advanced
Pen tool skills in illustrator for beginners
MS Excel
Learning English Speaking
Video Editing with Premiere Pro for beginner
Types of networking for beginners
Communication Skills
Python programming language
Computer Hardware Repair Techniques
Canva design basics for beginners
Python string formatting essentials
AutoCAD 3D rendering techniques
English Speaking
Blockchain development essentials for beginners
Content types in instagram for beginner
Affiliate marketing essentials for beginner
Computer Networking Full
Human Psychology
Video Editing Techniques for beginners
Bootstrap file structure essentials
Recent
Bootstrap file structure essentials
Pen tool skills in illustrator for beginners
Video Editing with Premiere Pro for beginner
Content types in instagram for beginner
Creating websites with elementor Pro for beginner
Creating Portfolio using wordPress and elementor
Creating a booking system with wordPress
Affiliate marketing essentials for beginner
Creating affiliate marketing website for beginner
WordPress theme development fundamentals for beginner
Typescript types for beginner
React Js features for beginner
Social media optimization techniques
Audio editing in adobe audition for beginners
Link building strategies for blogging
App store optimization strategies
Facebook ads audience types
Freelancing in digital marketing for beginners
Python string formatting essentials
Affiliate marketing programs for beginners