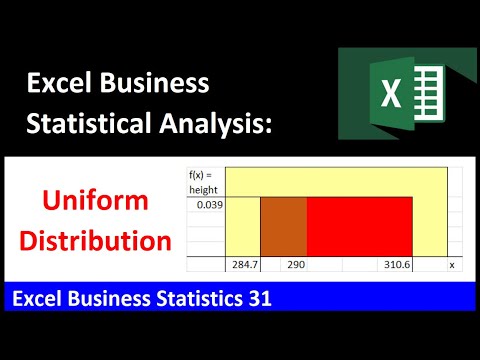
Excel Statistical Analysis 40 Confidence Interval for z Distribution use when Sigma Known
Share your inquiries now with community members
Click Here
Sign up Now
Lesson extensions
Lessons List | 65
Lesson


Show More
Lessons
Comments
Our New Certified Courses Will Reach You in Our Telegram Channel
Join Our Telegram Channels to Get Best Free Courses
Join Now
We Appreciate Your Feedback
1 Reviews

spry collections
Show More Reviews
Related Courses in Business


Course Description
Excel statistical analysis for business course,
in this course we'll delve into the powerful world of statistical analysis using Excel, tailored specifically for business applications. Excel offers a wide range of statistical functions and tools that can help you make informed decisions, identify trends, and uncover insights within your business data.
From basic descriptive statistics to advanced predictive modeling techniques, we'll cover it all. You'll learn how to calculate measures of central tendency, dispersion, and correlation, and how to create visually impactful charts and graphs to present your findings effectively.
We'll explore regression analysis to understand the relationships between variables, hypothesis testing to make data-driven decisions, and time series analysis to forecast future trends. Moreover, we'll dive into the realm of data visualization using Excel's powerful charting features to communicate your insights clearly to stakeholders.
Trends
Learning English Speaking
MS Excel
Python programming language
Excel Course Basic to Advanced
Daily conversational English
Semiconductor Materials in Electronic Devices
Java datatypes and variables
Microsoft Excel Basics
2D Animation Portfolio design for freelancing
Python typeCasting essentials for beginners
Digital Marketing
Professional Makeup
Embedded Systems ES
Photo Editing
Aprender a Programar desde
Languages of Europe
iTB 3rd Annual Conference
C Programming Language
Photography
A1 A2 Elementary Level Basic English | English Grammar | Online English
Recent
2D Animation Portfolio design for freelancing
Creating campaigns in google ads for beginners
Liquid Text Logo with after effects animation
After effects for text animation techniques
Creating pattern design in Illustrator for beginners
Character animation in after effects for beginners
Creating 3D typography in Illustrator for beginners
Text masking effect in photoshop for beginners
video intros in after effects for beginners
Logo design with after effects animation
Infographic animation in after effects techniques
Isometric animation in after effects for beginners
3D Shapes in after effects without Plugin
Cinema 4D Flower Vase design for beginners
Fingerprint animation in after effects for beginners
Creating 3D animations with android apps
Creating Kids cartoon video fundamentals
Mutual Funds fundamentals
Creating animated characters from scratch
Creating animated videos from scratch