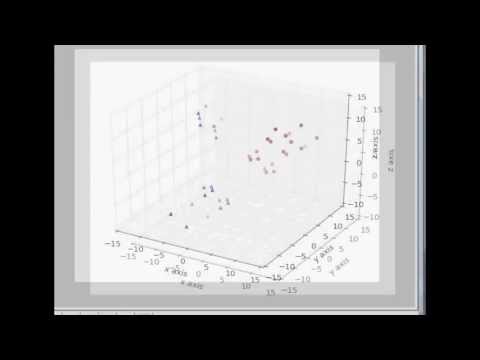
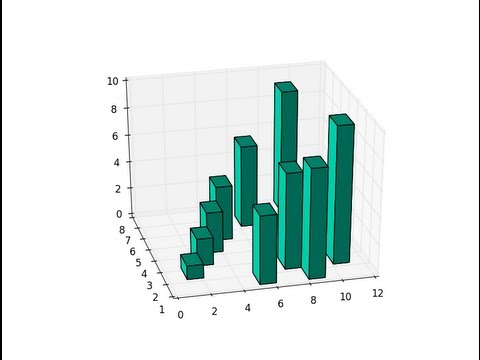
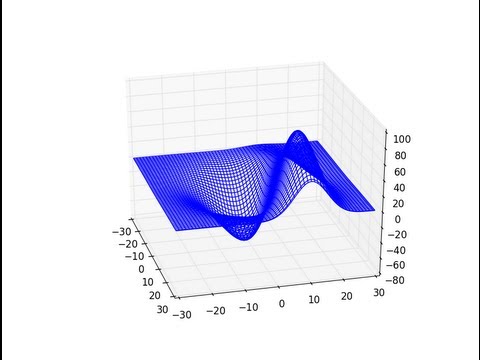
3D Plotting in Matplotlib for Python 3D Scatter Plot
Share your inquiries now with community members Click Here
Sign up Now
Lessons List | 5 Lesson


Comments
Our New Certified Courses Will Reach You in Our Telegram Channel
Join Our Telegram Channels to Get Best Free Courses
Join Now
We Appreciate Your Feedback
3 Reviews

Madhusudan Chaurasiya
Kachalla Ahmadu Kwano

Neetu Maurya
Show More Reviews
Related Courses in Graphic Design


Course Description
In order to plot 3D figures use matplotlib, we need to import the mplot3d toolkit, which adds the simple 3D plotting capabilities to matplotlib. Once we imported the mplot3d toolkit, we could create 3D axes and add data to the axes. Let's first create a 3D axes.
Trends
MS Excel
Python programming language
Learning English Speaking
Excel Course Basic to Advanced
Communication Skills
AI Ethics principles and governance
SEO Google Digital Marketing
Network Theory basics for Beginners
Google Sheets
Artificial Intelligence AI new
Magento Formation Français
Photoshop text masking effect methods
Digital Marketing Hacks for beginner
English Language
Human Psychology
Digital Marketing
Digital Marketing Beginners
Cloud Computing Arabic Course
Design and Analysis of algorithms DAA
Introduction to Leadership
Recent
Digital Marketing Hacks for beginner
Human Psychology
Bitcoin Cryptocurrency Knowledge
Technical Analysis for Beginners
Motivational Speech 2024
Talent platform operation guide
Artificial Intelligence AI new
Artificial Intelligence AI Arabic
Cloud Computing Arabic Course
Routing Switching
Security Course Revision
Access Network Arabic
Security Arabic
Routing Switching Arabic
iTB 3rd Annual Conference
Taking Exam Process 2023
AMAZON BOOK PUBLISHING MASTERY
ONLINE BUSINESS MASTERY
MOTIVATION INSPIRATION
MONEY INVESTING MASTERY