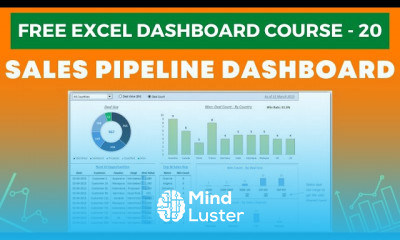
Excel Dashboard Course 21 Creating a Pivot table Dashboard with Slicers in Excel in 15 minutes
Share your inquiries now with community members
Click Here
Sign up Now
Lessons List | 21
Lesson
Comments
Related Courses in Computer Softwares
Course Description
Dashboards in Excel
An Excel dashboard is one-pager (mostly, but not always necessary) that helps managers and business leaders in tracking key KPIs or metrics and take a decision based on it. It contains charts/tables/views that are backed by data. A dashboard is often called a report, however, not all reports are dashboards.How do I create a dashboard in Excel?
Here's a step-by-step Excel dashboard tutorial:
How to Bring Data into Excel. Before creating dashboards in Excel, you need to import the data into Excel. ...
Set Up Your Excel Dashboard File. ...
Create a Table with Raw Data. ...
Analyze the Data. ...
Build the Dashboard. ...
Customize with Macros, Color, and More.How do you create a dashboard?
How to design and build a great dashboard
Be clear about what you're trying to achieve – your board's purpose will inform its design.
Only include what's important – everything should support your board's intent.
Use size and position to show hierarchy – make it clear to the viewer what's most important.How do I create a dynamic dashboard in Excel?
Create a dynamic Excel chart and make your own dashboard
Add a dynamic column to the data range using a HLOOKUP() function. This column will be the chart's real source, not the data range.
Insert a simple chart.
Add a scroll bar control that lets the user easily update the chart's source, without really knowing what's going on behind the scenes.
Trends
Learning English Speaking
MS Excel
Python programming language
Web Design for Beginners
Communication Skills
Photo Editing
Excel Course Basic to Advanced
English Language
Python in Hindi
IELTS exam english
Content Marketing
English Grammar for Beginners
Every Photoshop
French
Formation efficace à l écoute de l
Python Programming | Edureka
Graphic Design | Photoshop
Основы after effects
Logo Design
British accents for beginners
Recent
IELTS exam english
Business english vocabulary and idioms
Improve english vocabulary
Basic english grammar
Confusing english verbs
Prepositions in english
English tenses
Essential english phrasal verbs
British english grammar for beginners
Essential english idioms
British accents for beginners
English british pronunciation practice
British phrasal verbs
Essential business english phrases
British english pronunciation
English phrasal verbs
English alphabet pronunciation
English british traditions
British slang words
Advanced english vocabulary


