×
MindLuster Logo
Join Our Telegram Channel Now to Get Any New Free Courses : Click Here

Making bar graph model 3d

Track :

Science

Course Presenter :

howtofunda

Lessons no : 5

For Free Certificate After Complete The Course

To Register in Course you have to watch at least 30 Second of any lesson

Join The Course Go To Community Download Course Content

What will you learn in this course?
  • Create 3D bar graph models using simple materials like cardboard, foam, or wooden blocks for data visualization
  • Label axes accurately and scale data properly to enhance clarity in 3D bar graphs
  • Compare and interpret data visually by constructing and analyzing 3D bar graph models
  • Apply 3D bar graph techniques to real-world data, science projects, and educational presentations

How to Get The Certificate

  • You must have an account Register
  • Watch All Lessons
  • Watch at least 50% of Lesson Duration
  • you can follow your course progress From Your Profile
  • You can Register With Any Course For Free
  • The Certificate is free !
Lessons | 5


We Appreciate Your Feedback

Be the First One Review This Course

Excellent
0 Reviews
Good
0 Reviews
medium
0 Reviews
Acceptable
0 Reviews
Not Good
0 Reviews
0
0 Reviews

Our New Certified Courses Will Reach You in Our Telegram Channel
Join Our Telegram Channels to Get Best Free Courses

Join Now

Related Courses

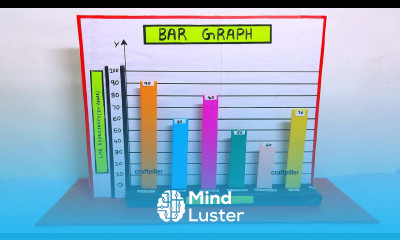
Making bar graph model 3d, in this course introduces students to a creative way of learning data visualization by building a three-dimensional bar graph. In this course, learners explore how numerical data can be represented visually through bars of varying heights or lengths, making complex information easier to understand. Step-by-step guidance is provided on designing and constructing the 3D model using simple materials such as cardboard, colored paper, foam, or wooden blocks. Students learn how to label axes, scale data properly, and highlight comparisons between different values. By building the model, learners not only understand the mathematical concept of bar graphs but also improve their analytical and presentation skills. The course encourages creativity, critical thinking, and hands-on learning, showing how graphs are used in science, economics, and daily life to interpret information. Ideal for school projects, exhibitions, and competitions, this course makes math and science engaging, practical, and interactive for students. howtofunda