How to Make a Gantt Chart in Excel
Share your inquiries now with community members
Click Here
Sign up Now
Lesson extensions
Lessons List | 5
Lesson
Comments
Related Courses in Computer Science
Course Description
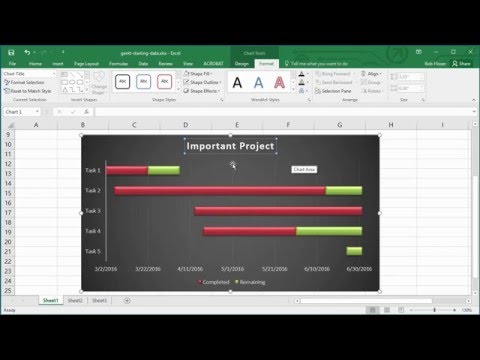
Calculate Percentages in excel course,
in this course we will delve into the functionalities of Excel for calculating percentages efficiently. From basic percentage calculations to more advanced formulas and functions, learn how to analyze data, create charts, and present insights effectively using Excel's powerful tools. Ideal for professionals, analysts, and students seeking to enhance their data manipulation and analysis skills in Excel.
Trends
Graphic design tools for beginners
Learning English Speaking
Artificial intelligence essentials
MS Excel
Data Science and Data Preparation
French
Data types in python and ruby
American english speaking practice
Formation efficace à l écoute de l
Excel fundamentals for finance
Python programming language
Electrical engineering for engineer
C Programming
Figma for UX UI design
Web Design for Beginners
English vocabulary verbs
Reading financial statements
Python algorithms
Marketing basics for beginners
AUTOMATA THEORY
Recent
NumPy array creation
Spring AI
ESG fundamentals
Reading financial statements
Excel fundamentals for finance
Corporate finance fundamentals
Creating a SIPOC diagram
Impact effort matrix
Staying calm at work
Prioritizing Stakeholders
One on One meetings
Business process management
Transferable skills
Communication skills for introverts
Ways to reduce stress at work for beginners
Stakeholder management
First time managers succes skills
Data types in python and ruby
Game programming project
Python algorithms