Course Description
Percentage change in excel charts course,
in this course we will learn about the Percentage Change in Excel Charts, a crucial skill for analyzing and visualizing data trends over time. This course is designed for anyone looking to enhance their data analysis capabilities by effectively using Excel to calculate and display percentage changes.
We will start with the basics of calculating percentage change, using the formula:
Percentage Change
=
(
New Value
−
Old Value
Old Value
)
×
100
Percentage Change=(
Old Value
New Value−Old Value
)×100
You will learn how to apply this formula to your datasets, ensuring accurate and meaningful results.
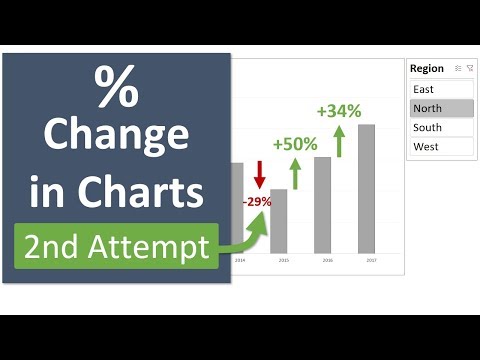
Next, we will explore how to create various types of charts to visualize these percentage changes. You will learn to use line charts, bar charts, and column charts to clearly present the data. We will cover advanced techniques, such as dynamic charts that update automatically as new data is entered, and conditional formatting to highlight significant changes.
The course will also delve into combining percentage change calculations with Pivot Charts, allowing you to analyze large datasets interactively. We will look at best practices for formatting and labeling your charts to enhance readability and impact.
Practical examples and hands-on exercises will reinforce your understanding and provide you with the skills needed to apply these techniques to real-world data. By the end of this course, you will be proficient in using Excel to calculate, analyze, and visualize percentage changes, enabling you to make data-driven decisions and communicate your findings effectively.