Using SVG in React Native
Hide All Ads - Subscribe Premium Service Now
Share your inquiries now with community members
Click Here
Sign up Now
Lessons List | 5
Lesson

Comments
Our New Certified Courses Will Reach You in Our Telegram Channel
Join Our Telegram Channels to Get Best Free Courses
Join Now
We Appreciate Your Feedback
90 Reviews

Sooraj Kumar

BGMi Nub

Shailesh Gaikwad
Manohar Rajendra Sonawane
Show More Reviews
Related Courses in Computer Science


Course Description
What is a good data visualization?
A good visualization should establish two aspects of the data being presented: Show connections within the data that are too complex to explain with words. Make it easier for the audience to quickly understand the information presented and consider the outcomes from that data. useful ways to visualize your data (with examples)
Indicator. If you need to display one or two numeric values such as a number, gauge or ticker, use the Indicators visualization. ...
Line chart. The line chart is a popular chart because it works well for many business cases, including to: ...
Bar chart. ...
Pie chart. ...
Area chart. ...
Pivot table. ...
Scatter chart. ...
Scatter map / Area mapWhat is Data Visualization in Data Analytics?
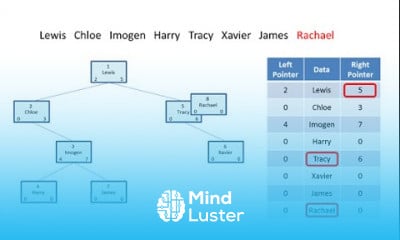
Data visualization is the graphical representation of information and data. By using visual elements like charts, graphs, and maps, data visualization tools provide an accessible way to see and understand trends, outliers, and patterns in data.
Trends
Graphic design tools for beginners
MS Excel
Learning English Speaking
Create cinematic ai landscapes videos
Google Python class
Python programming language
French
Create AI Videos
AWS For Beginners | Amazon AWS
Communication Skills
10X coding tools for developers
French language for beginners
Excel fundamentals for finance
Basic mathematics
Python machine learning from scratch
American english speaking practice
Embedded Systems ES
Workplace Communication skills for beginners
Logistic regression machine learning
Content marketing for beginners
Recent
HSPICE installation
Smart irrigation system
Python for data science fundamentals
Azure IoT webservices
Machine learning for beginners
IoT networking basics
SystemVerilog interview questions
Engineering chemistry fundamentals
Engineering thermodynamics
Mechanics
Electromagnetic theory
Thermometry
Basic mathematics
Create cinematic ai landscapes videos
Ai photography basics
Tools for ai image
Create ai videos with moonvalley
Leonardo Ai
Making ai cartoon animation
Create cinematic Ai videos