×
MindLuster Logo
Join Our Telegram Channel Now to Get Any New Free Courses : Click Here

Data visualization

Track :

Computer Science

Lessons no : 10

For Free Certificate After Complete The Course

To Register in Course you have to watch at least 30 Second of any lesson

Join The Course Go To Community

How to Get The Certificate

  • You must have an account Register
  • Watch All Lessons
  • Watch at least 50% of Lesson Duration
  • you can follow your course progress From Your Profile
  • You can Register With Any Course For Free
  • The Certificate is free !
Lessons | 10

Recommended Courses


We Appreciate Your Feedback

Excellent
45 Reviews
Good
48 Reviews
medium
11 Reviews
Acceptable
2 Reviews
Not Good
3 Reviews

4.2

109 Reviews


Naveen

Very nice 2023-12-08

Shah Sawar

exellent 2023-09-30

Oladele oguns

The Course is very interesting 2023-08-09

M. suresh

Great views but last one video not play 2023-07-21

Show More Reviews

Our New Certified Courses Will Reach You in Our Telegram Channel
Join Our Telegram Channels to Get Best Free Courses

Join Now

Related Courses

Free Data visualization tutorial, Data visualization (often abbreviated data viz) is an interdisciplinary field that deals with the graphic representation of data. It is a particularly efficient way of communicating when the data is numerous as for example a time series. 
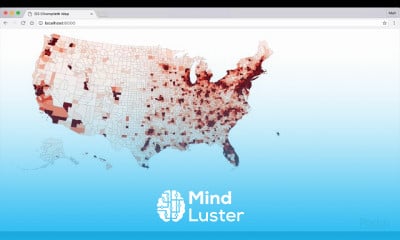
Of course, one of the best ways to understand data visualization is to see it. What a crazy concept! With public data visualization galleries and data everywhere online, it can be overwhelming to know where to start. We’ve collected 10 of the best examples of data visualization of all time, with examples that map historical conquests, analyze film scripts, reveal hi… 
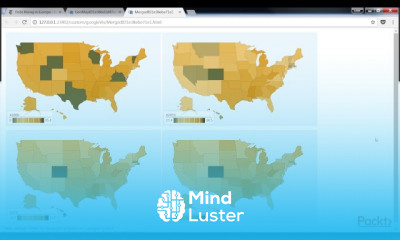
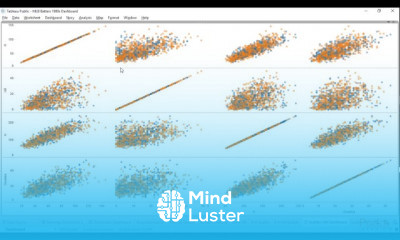
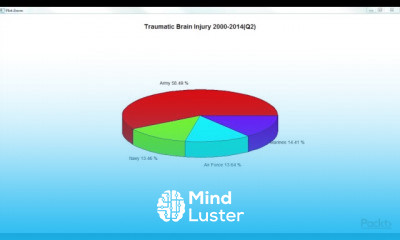
Data visualization is the graphical representation of information and data. By using visual elements like charts, graphs, and maps, data visualization tools provide an accessible way to see and understand trends, outliers, and patterns in data.